All things considered, it could have been worse … and for the better part of Monday, it was. The S&P 500’s loss of 0.45% yesterday was a huge pare-back from what at one point was nearly a 2% drubbing driven by renewed worries of economic headwinds.

Advanced Micro Devices (NASDAQ:AMD) inflicted the most net damage, falling 2.8% after President Trump threatened to put new tariffs in place on China’s imports of U.S. goods. Advanced Micro Devices is one of the more vulnerable chipmakers. Affiliated Managers Group (NYSE:AMG) lost more ground of its own though, off 11.6% after a disappointing Q1 report was worsened by news that CEO Nathaniel Dalton would be stepping down due to illness.
At the other end of the spectrum, Coty (NYSE:COTY) rallied nearly 6%, largely driven by the acceptance of the tender offer from JAB Holding.
But headed into Tuesday’s trading, the stock charts of General Electric (NYSE:GE), Citrix Systems (NASDAQ:CTXS) and NRG Energy (NYSE:NRG) are of the most interest. The broad market is clearly vulnerable, and traders need to be even pickier than usual about selecting stocks.
NRG Energy (NRG)
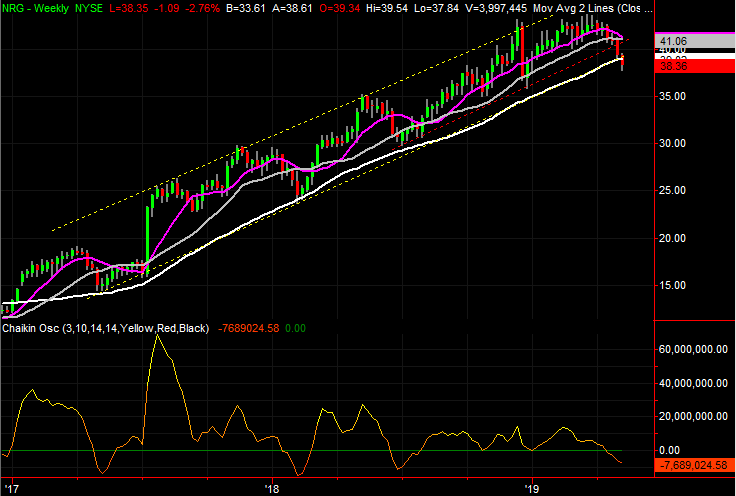
A week ago, NRG Energy was rolling over in a gradual, arc-shaped way that we hadn’t seen in months. It could mean this wave of weakness was a little more calculated than the past ones had been, and as such, it could last longer. On the other hand, none of the key support levels that were keeping NRG stock pushing forward had been broken. The U-shaped rollover could mean nothing.
It’s starting to look like it meant something. In just the past five trading days, NRG Energy shares broke below both of the aforementioned technical floors. We’re in uncharted waters now, fighting what looks like will be a losing battle.
Click to Enlarge
- The two technical floors in question are plotted with dashed lines on both stock charts. The near-term support line plotted in red touched the key lows going back to July. The longer-term line is in yellow and it touches the key lows going back to 2017.
- Thanks to yesterday’s sizeable stumble, NRG Energy is also below the white 200-day moving average line for the first time since the beginning of 2017.
- The volume behind the pullback was modest, until late last week and Monday. A couple of high volume selloffs evident on the daily chart finally dragged the weekly chart’s Chaikin line below zero in a big way.
General Electric (GE)
General Electric hasn’t been a particularly easy name to own of late, even for speculative reasons. Just when it looks like it’s on the mend, the wrong headline surfaces and up-ends a budding rally effort.
Things are slowly but surely changing for the better though, and one more good day could be a game-changer. A lot of the heavy lifting has already been done, and some programmatic or algorithmic buying could be in the offing.

Click to Enlarge
- When we last looked at GE back on April 30, it had just pushed up and off of its gray 100-day moving average line, and it had just fully closed a key gap left behind in late March.
- While last week’s productive move carried General Electric shares above the pivotal 200-day moving average line, plotted in white on both stock charts, the March peak of $10.50 has once again stepped up as a technical ceiling.
- Although it still won’t happen for a few days, at least, the purple 50-day line is close to clearing the 200-day moving average line. This so-called “golden cross” is a well-watched buy signal for many professional and amateur traders.
Citrix Systems (CTXS)
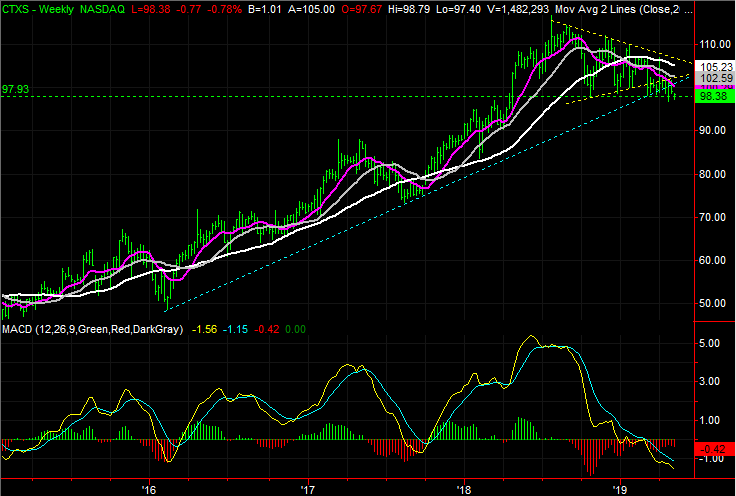
Finally, for the better part of the past several weeks, we’ve been following the technical path of Citrix Systems shares. As of our most recent look from April 18, the stock had just bumped into its 50-day moving average line to remain stuck below the lower edge of a near-term converging wedge pattern.
CTXS has remained in that downtrend in the meantime, briefly toying with a break under a horizontal support level before recovering in late April. As of yesterday though, that floor has once again been tested and the bulls aren’t nearly as keen at staging a rebound effort.
Click to Enlarge
- The horizontal support line in question is right around $98, plotted in green on both stock charts.
- Although it’s technically back above that floor thanks to yesterday’s partial bounceback, notice how much resistance is being supplied by the purple 50-day moving average line.
- Zooming out to the weekly chart it’s easy to see that Citrix Systems shares have already broken below the long-term support level that had tagged the major lows going back to the early 2016 bottom.
As of this writing, James Brumley did not hold a position in any of the aforementioned securities. You can learn more about James at his site, jamesbrumley.com, or follow him on Twitter, at @jbrumley.