Picking up where they left off on Friday, traders lifted the market to another record close on Monday. The S&P 500’s close of 2,943.03 was 0.11% better than last week’s close, though on oddly light volume. Investors are less willing to plow in the higher stocks climb, particularly without a clear economic catalyst.

Yesterday’s triumph would not have happened without Alphabet (NASDAQ:GOOG, NASDAQ:GOOGL) and Bank of America (NYSE:BAC). BofA shares were up 1.4%, in step with a broad rise for the entire sector’s names on Monday. And, Alphabet shares were up 1.2% headed into a post-close earnings report that actually sent shares down more than 6% in after-hours trading. Revenue growth slowed rather dramatically, causing the company to fall short of top-line estimates.
Intel (NASDAQ:INTC) was at the other end of the spectrum, falling another 2.5% as investors continue to file out of the tech name following last week’s lackluster quarterly report.
None are great prospects for today, however. Rather, it’s the stock charts of General Electric (NYSE:GE), NRG Energy (NYSE:NRG) and Fiserv (NASDAQ:
FISV) that are worth the closest looks. Here’s why, and what to look for.
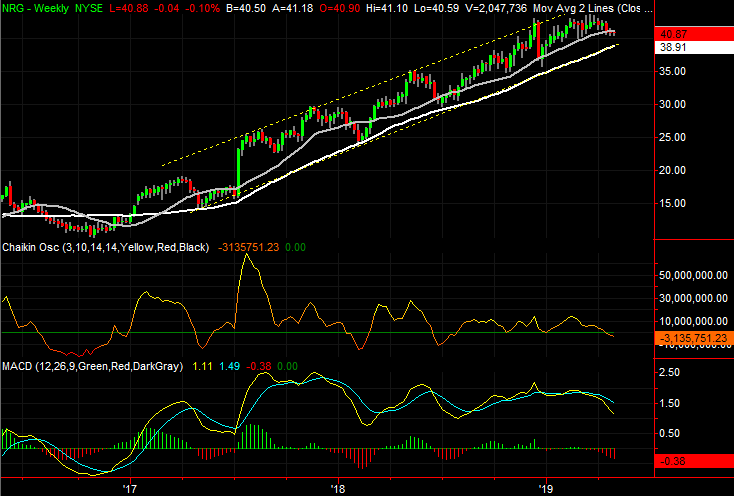
NRG Energy (NRG)
For the better part of the past couple of years, NRG Energy has made net progress, but it has done so in fits and starts. NRG has zig-zagged its way from the upper to the lower edge of a long-term trading range, framed in yellow on the weekly chart.
That changed beginning late last month, with a slow arc out of a rally into a downtrend. The outcome will likely be the same as the last few pullbacks have been. But, with the change in character taking shape after a long-term rally, if there was ever a time for the pattern to be broken, this is it.
Click to Enlarge
- The line in the sand is around $38.50, where the white 200-day moving average line, as well as, the lower edge of the rising trading channel have converged.
- Between here and there, a minor support line could stand in the way. The floor that tagged the low from July and January, plotted in red on the daily chart, may put up a fight.
- If the ultimate technical floor fails to hold up, there’s no clear support level that might become a support level once any selling gets going in earnest.
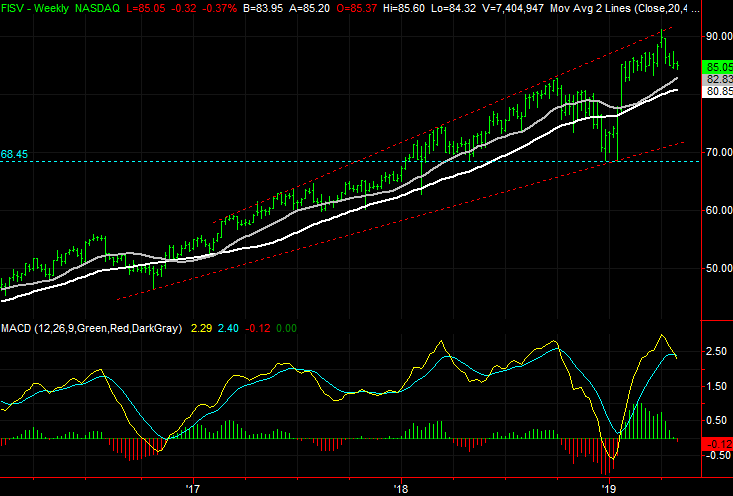
Fiserv (FISV)
Fiserv has been vulnerable to a pullback since January, right after an overheated runup materialized. It never happened though. While the advance cooled down, it still kept moving.
That may be about to change though. With one last “umph” in late-March and early April, FISV may have emptied its tank and moved into a foreboding position headed into Tuesday’s action.
Click to Enlarge
- The position in question is a head-and-shoulders pattern; the neckline is plotted with a white dashed line on the daily chart. If that floor breaks, it could open the selling floodgates.
- Adding to the bearish case is the way Fizerv stock only has to kiss the upper boundary of the rising trading range that has been in place since the beginning of 2017 to start peeling back.
- Should the budding breakdown take hold, there are several plausible floors. The one that would be easiest to overlook is $68.45, which is plotted with a blue dashed line on both stock charts. That’s where FISV found lows a couple of different times last year.
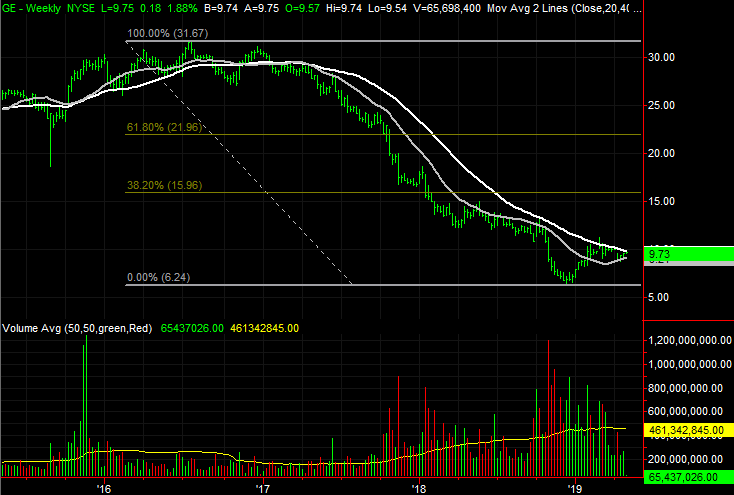
General Electric (GE)
After a torturous 2018, General Electric shares have hinted several times that a rebound was in the works. It just hasn’t happened yet.
Over the course of the past few days, however, not only have the bulls pushed GE stock back into bullish mode, but they have gotten the beleaguered stock into the best possible rebound backdrop we’ve seen since that effort began late last year.
Click to Enlarge
- One of the key issues with the rebound from January was the big gap left behind late in the month. That gap, marked with a white dashed line on the daily chart, was closed thanks to weakness seen earlier this month.
- Also earlier this month, General Electric stock has found support at, and then pushed up and off of, the gray 100-day moving average line.
- The key line in the sand is still the 200-day moving average line, plotted in white on both stock charts. Shares were briefly above that line in February, but sometimes turnarounds are more of a process than an event.
- If the potential breakout does take hold, the next most likely technical ceiling is the 38.2% Fibonacci retracement line at $15.96.
As of this writing, James Brumley did not hold a position in any of the aforementioned securities. You can learn more about James at his site, jamesbrumley.com, or follow him on Twitter, at @jbrumley.