Shares of General Electric (NYSE:GE) have been holding their ground so far in 2019. GE stock, which was suffering from a precipitous decline going into the end of 2018, has drawn interest from retail investors for a long time. That’s because for many years GE was an American industrial icon.

The power, energy, aerospace and consumer-staples sectors all used products with the well-known “GE” logo. Mismanagement, poor acquisitions, pension obligations and low-quality cash flows ultimately led to GE’s demise, though. These issues were slowly (and rather painfully) uncovered as investors began to realize what the cash-flow statements and balance sheet were suggesting.
GE stock entered 2017 at almost $30 a share. In December 2018, it hit a low near $6.50 and ultimately fell more than 75% from peak to trough.
What do the charts of GE stock suggest now?
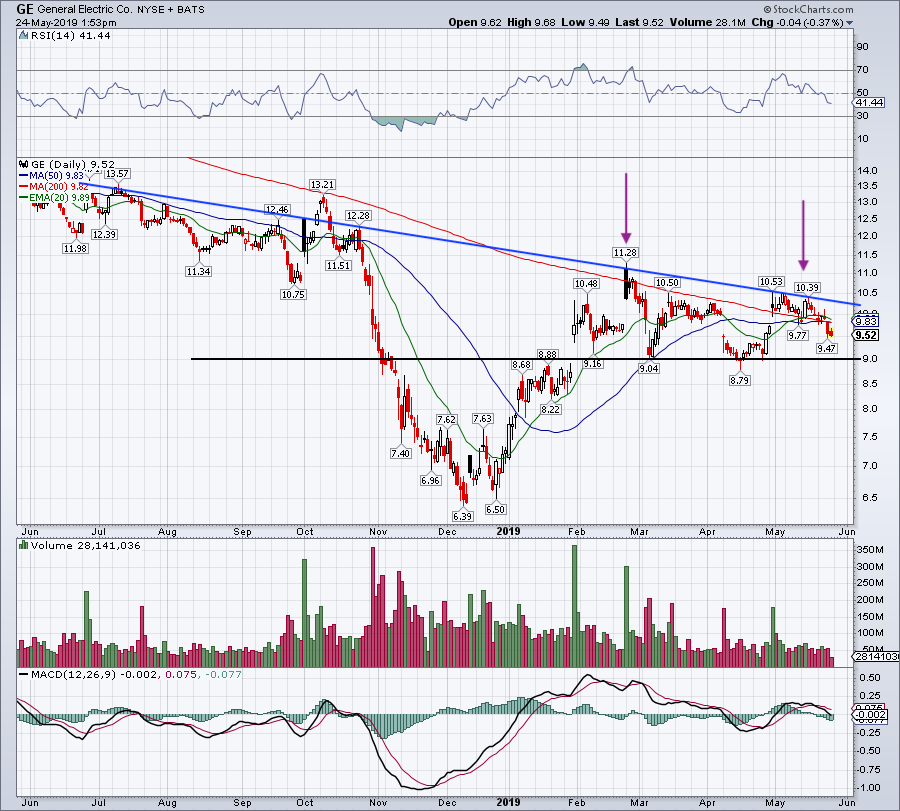
Click to Enlarge
If investors bought General Electric stock back in December, they’re doing quite well. But even that massive rally — during which GE stock jumped some 70% — wasn’t enough to propel GE out of its downtrend. As you can see on the daily chart above, GE continues to squeeze lower.
The 200-day moving average isn’t doing GE stock any favors, and GE is now below all three major moving averages. We’ve flagged $9 as support a few times, a level that has now held through two earnings reports. But as GE’s highs continue to drop, this $9 level is starting to look suspect.
If GE stock can’t bounce back over its major moving averages and eventually exceed its downtrend resistance, its support could be in jeopardy. If $9 doesn’t hold, sub-$8 prices don’t seem unreasonable, particularly if sentiment towards GE stock sours as well.
A similar scene is playing out on the weekly chart, as shown below.
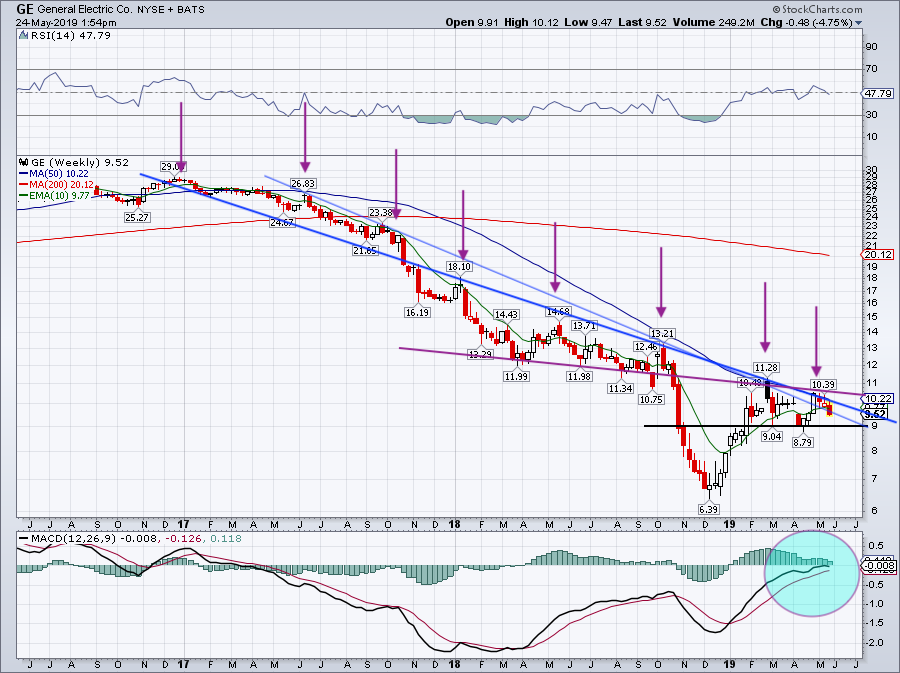
Click to Enlarge
On this chart, downtrend resistance is much more prominent. A series of purple arrows highlights the “lower highs” theme we’ve seen playing out for some time now. Like the 200-day moving average, the 50-week moving average is still providing stiff resistance. While the 10-week moving average had been a support level from January through March, it has wavered over the past seven weeks. Last week, it gave way, and a test of $9 would not be surprising now.
GE stock has “descending triangle” written all over it. That is, the stock is making continuously lower highs and moving ever closer towards its support level. If GE stock closes below $9, it will deal a big blow to the bulls. If General Electric stock closes over $10.40-$10.50, a lot of the recent damage could be repaired, potentially sparking a rally by GE.
The Bottom Line on GE Stock
JPMorgan
analyst Stephen Tusa has very closely followed GE stock, and he’s made some very good calls on it. He was the first to downgrade GE to “sell” and rode it all the way lower until December. That’s when he raised his “sell” rating to a “hold,” but maintained his $6 price target. Tusa questioned where all the optimism was coming from and remains highly skeptical about General Electric stock.
In April Tusa went back to a “sell “rating, cutting his price target on GE stock to $5 from $6. On May 1, he said the company’s first-quarter earnings results were “far from a disaster,” which may seem encouraging, but he also said they were “far from a blowout.”
So where are we now? I’ve been following the action of GE stock, and it’s telling me one thing: General Electric is a “show-me” stock. Meaning, GE needs to prove that it’s got its groove back, and it is not worthy of benefit-of-the-doubt treatment. It doesn’t help that Honeywell (NYSE:HON), 3M Co (NYSE:MMM), and United Technologies (NYSE:UTX) are all better companies and have been under pressure lately as well.
On Wednesday, GE CEO Larry Culp reiterated the company’s forecast for up to $2 billion of negative free cash flow (FCF) this year and flat FCF in 2020. That has done little to instill confidence in GE stock lately, even though that type of outlook has boosted GE stock in the past. The failure of General Electric stock to rally on the guidance reiteration makes me confident about avoiding the name for now, even if I miss some gains as a result.
Watch how GE handles $9. If it falls below that level, it’s in trouble. But if GE stock overcomes its resistance, it may be worth buying.
Bret Kenwell is the manager and author of Future Blue Chips and is on Twitter @BretKenwell. As of this writing, Bret Kenwell did not hold a position in any of the aforementioned securities.