When it comes to Square (NYSE:SQ), do you view the glass as half full or half empty? Optimists will say the stock’s year-long consolidation is a great way to digest the stock’s massive gains over the past few years. Pessimists will argue that Square stock has underperformed the Nasdaq, as well as stocks like PayPal (NASDAQ:PYPL) over the past year and looks to be rolling over.

So which is it?
If you ask the analysts, it’s certainly not the latter. Over the last month, SQ stock has received six analyst actions. They’ve all been buy ratings, with five analysts assigning a price target.
Of those five, the average target came out to $93.20, which implies 28% from Friday’s close. The highest target stretched up to $100 and comes from KeyBanc analyst Josh Beck. The lowest target of the bunch is $86 from JPMorgan.
Sizing Up Square Stock
Despite the lulling stock price, SQ stock still has relatively robust growth. Analysts expect 2019 sales to grow 43.5% to $2.28 billion. Expectations call for revenue to eclipse $3 billion in fiscal 2020, growing by more than 34%.
Earnings growth is even more impressive, as Square management focuses on the bottom line. Current estimates call for 62% growth this year to 76 cents per share and almost 50% growth in 2020 to $1.13 per share.
Of course, that brings up the main criticism of Square, which is its valuation. At current levels, shares trade at 96 times this year’s earnings expectations. On a revenue basis, SQ stock price trades at 13.5 times sales. However, the stock’s forward P/E ratio has been cut in half, as the paused stock price allows the fundamentals to catch up.
Further, if its market cap were to get cut in half, say down to $15 billion, it would be a surefire M&A play. That keeps some form of a bid in the stock. That’s not to say M&A would offset a complete deterioration in the fundamentals, but it does add a premium to Square’s valuation. A growth premium justifies the rest. If Square can grow revenue by 20% after 2020, it will generate more than $5.3 billion in revenue in 2023. That could prove conservative at this point.
Free cash flow generation has also become more robust. Just a few quarters ago, SQ had trailing free cash of roughly $80 million. Two years ago it was free cash flow neutral. Now? That figure is north of $200 million.
The valuation doesn’t justify the current-year fundamentals, but SQ’s year-long consolidation has made it more reasonable (although still too rich for some), while
investors buy with the future in mind.
Trading Square Stock
Click to Enlarge
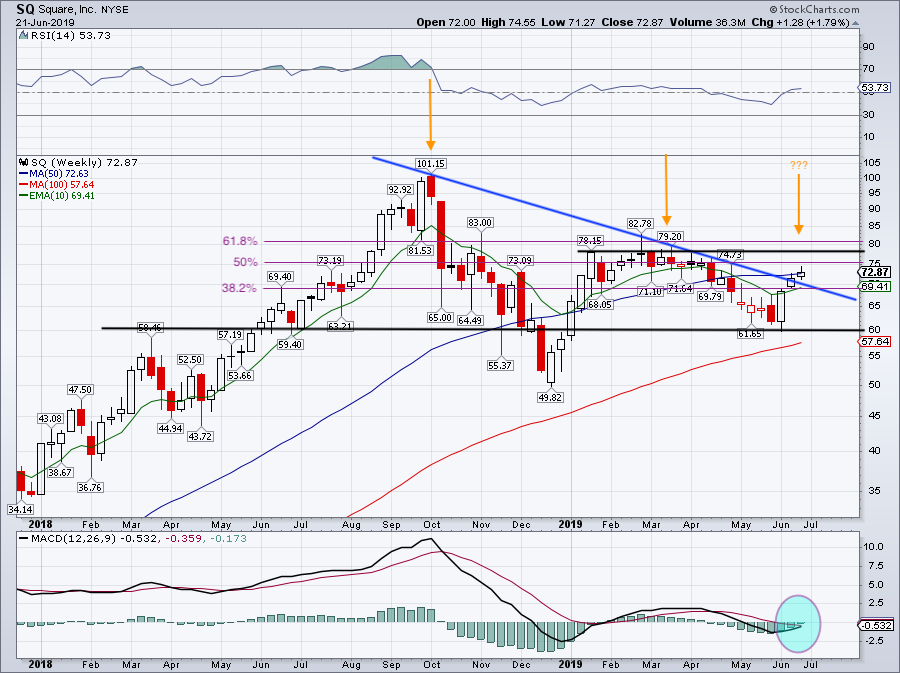
So where does that leave Square stock price? It’s mostly trading inside the middle of its one-year range.
SQ stock tried but couldn’t end last week north of its 50-week moving average. That said, it’s above its 100-week moving average while its 10-week moving average is trending higher.
The 10-week and the 61.8% retracement for the one-year range both come into play near $69.40, which should buoy the name. So too does the backside of prior downtrend resistance.
Now that we know what Square stock has done, let’s map out some upside and downside levels.
If support gives way (so say below $67.50) then a drop down toward $60 is possible. That’s the month low and has proven to be significant over the past 18 months. There’s also the 100-week moving average at $57.64 and trending higher, which should buoy SQ stock price should it fall that far.
On the upside, I first need to see a close over the 50-week moving average. That brings up the $78 to $81 area. Throughout Q1 and Q2, this was an area of resistance. Not only would clearing this mark get SQ over resistance, but it could also put an end to the longer term lower-high trend we’ve been seeing (orange arrows).
For SQ stock to rip to those new price targets, it will need to clear this resistance area. On the plus side, clearing resistance combined with a bullish momentum turn via the MACD reading (blue circle) could fuel a run higher in SQ.
Bret Kenwell is the manager and author of Future Blue Chips and is on Twitter @BretKenwell. As of this writing, Bret Kenwell did not hold a position in any of the aforementioned securities.