U.S. stocks keep cruising higher. All three broad market indices closed Thursday at all-time highs. It’s not hard to see why.

Earnings season impressed, with Disney (NYSE:DIS) the latest major company to deliver an impressive report. Trade war negotiations are heading in the right direction. The “risk-on” trade has returned, as lower-risk treasuries and gold both sit a three-month low.
But as Friday’s three big stock charts show, a rising market tide doesn’t always lift all boats. These three names all have charts that suggest near-term downside risk — and all have fundamental questions. Broad market strength could reverse recent trading, but at least for now, investors should exercise caution.
Shopify (SHOP)
As a business, Shopify (NYSE:SHOP) continues to impress. Q3 earnings, despite a headline miss caused by a one-time tax miss, were solid. Revenue grew a staggering 45% year-over-year.
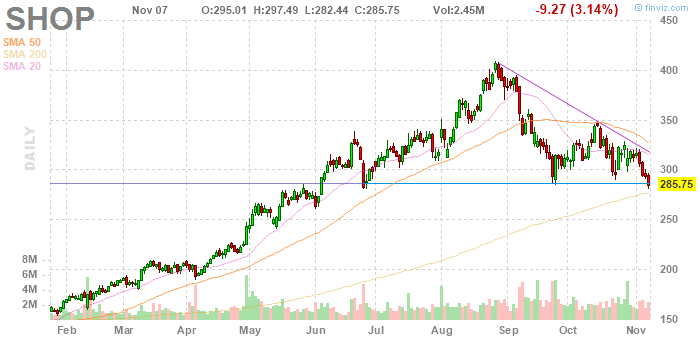
But as a stock, SHOP is in trouble, as the first of our big stock charts shows:
- Thursday’s 3% decline sent the stock just below support. Meanwhile, SHOP stock already has reversed below the 20- and 50-day moving averages, and it’s fast approaching the 200DMA. If SHOP falls through that support level, the declines can not only continue, but accelerate.
- Again, the sell-off is coming amid a market clearly willing to take on risk. But it’s also a market that seems more focused on valuation. Roku (NASDAQ:ROKU), which along with SHOP stock had been one of the two best large-cap stocks of 2019, started falling at the same time. Its bounce, too, has faded, and ROKU shares declined 16% on Thursday despite what looked like a blowout report. That response, and the concurrent decline in Shopify stock, suggest that valuation concerns persist.
- Those concerns aren’t close to being mitigated. SHOP stock has pulled back 30% from its highs. It’s still more than doubled so far this year, and still trades at 23x trailing twelve-month revenue. Increasingly, it looks like the days of investors paying any price for growth have ended. If that’s the case, SHOP stock could bust through support and continue its reversal.
Ameren (AEE)
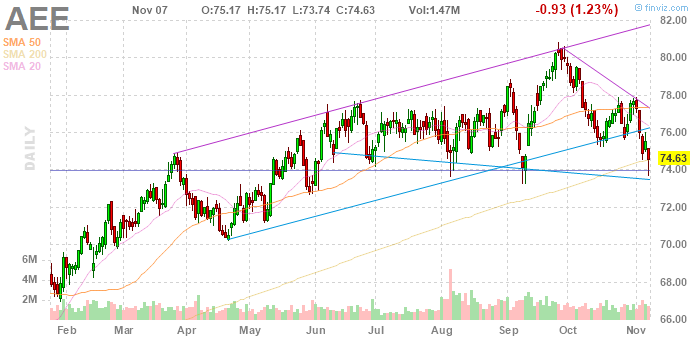
Lower treasury prices mean higher yields — and thus usually ofter demand for safe, dividend-paying utility stocks like Ameren (NYSE:AEE). The pullback in AEE stock seems likely driven at least in part by the decline in treasuries — but whatever the cause, the second of our big stock charts shows a stock that needs a reversal:
- AEE stock clearly has fallen out of its uptrend, and through all three moving averages. The support line around $74 is the next key test; if AEE falls through that level, the declines could accelerate.
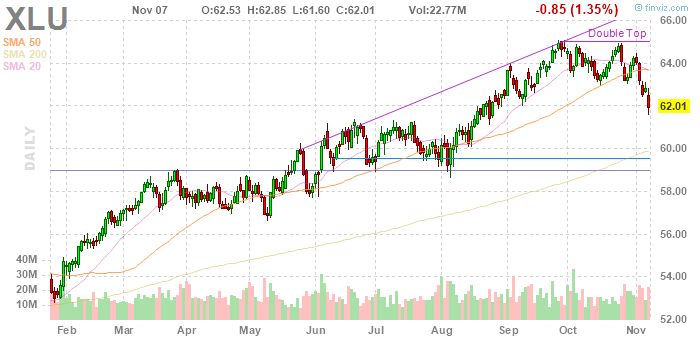
Click to EnlargeMeanwhile, the industry’s ETF, the Utilities Select Sector SPDR Fund (NYSE:XLU) is pulling back after a bearish double top formation. Sector pressure thus could continue on AEE stock, and potentially push it through support.- Ameren stock is reasonably attractive on a fundamental basis. And utilities are less volatile than the broader market, so downside risk is manageable. But amid the sector-wide sell-off, there are other options. American Electric Power (NYSE:AEP), for instance, has a stronger chart and a higher dividend yield. Investors looking to buy the dip in utilities thus might want to look elsewhere.
Becton Dickinson (BDX)
From a long-term perspective, there’s probably not much need to worry about medical supplies manufacturer Becton, Dickinson and Company (NYSE:BDX). Becton Dickinson has been a phenomenal value creator over time: shares of the Dividend Aristocrat have tripled in roughly seven years. Healthcare end markets provide protection against macro swings, and the company’s enormous scale limits competitors’ ability to undercut it on pricing.
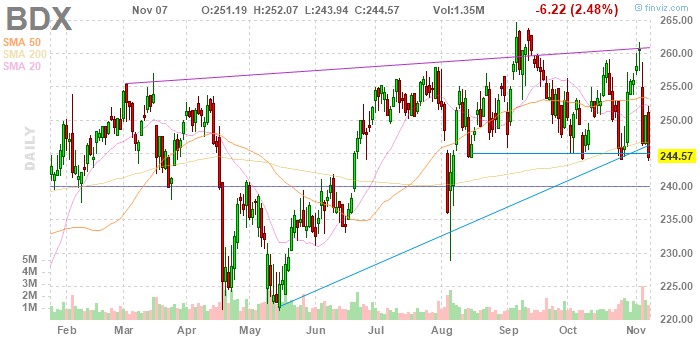
That said, BDX stock clearly has stalled out. And the third of our big stock charts suggests that this attractive business might soon be available at a cheaper price:
- Thursday’s 2.5% decline suggests a reversal out of a bearish rising wedge pattern. BDX stock is testing support at $245, with another potential level at $240, which acted as support earlier this year and resistance in the spring. At the least, it wouldn’t be a surprise to see the stock slip to that $240 level — which will provide a key test.
- BDX stock already has fallen below moving averages. Volume has been moderately higher than usual in recent sessions as well. Both factors generally bode poorly for near-term performance.
- Meanwhile, the recent selling has come in response to the company’s fiscal fourth quarter this week — which looks a bit soft. Notably, fiscal 2020 earnings per share guidance of $12.50-$12.65 was below Street consensus of $12.71. Here, as with the chart, there isn’t necessarily cause for panic. But the market’s reaction so far — BDX stock is down 6% since earnings — does suggest that investors were looking for more. They might not get it until at least next year.
As of this writing, Vince Martin has no positions in any securities mentioned.