The energy sector has been the worst-performing segment so far this year. When a sector is under-performing, it brings in investors looking for high yields and bargains. One of the popular high yield stocks within the energy sector is BP p.l.c. (NYSE:BP).
Currently, shares are yielding over 6%, which is a big draw for income investors in this market. As always, investors should look below the yield at the fundamentals to asses whether the dividend yield is worth the risk.
BP Stock Dividend
As I noted above, the dividend yield is the big draw for investors. I compared the dividend yield for BP to other major oil & gas companies: Exxon Mobil (NYSE:XOM), Royal Dutch Shell (NYSE:RDS.A) and Chevron (NYSE:CVX). Shell and BP have the highest dividend yield, followed by Exxon then by Chevron.
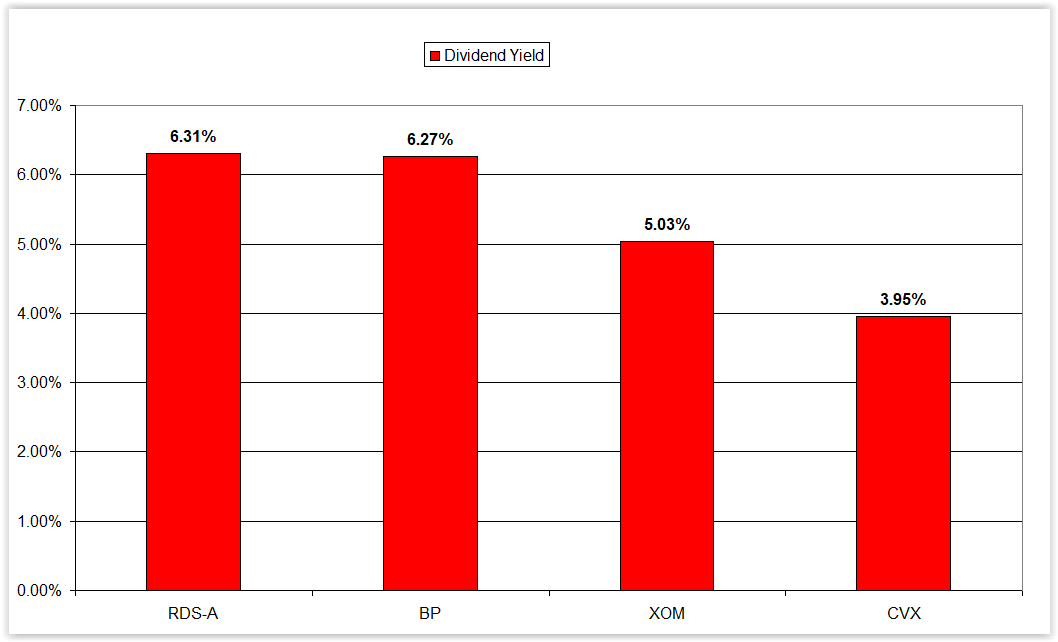
Click to EnlargeThere is a trade off for this high-yield though. While BP and Shell have the highest yields in the group, they have no dividend growth. BP has not increased its dividend since 2018 and the last increase for Shell was in 2017.
Fundamental Metrics
BP has a number of fundamental metrics that in my opinion show why the other major oil companies are a better value. The table below with data from Gurufocus shows the gross margins of each company over the past year.
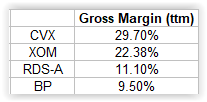
As you can see, BP has the lowest margins, which gives them less flexibility. Part of that flexibility is the option of repurchasing shares at depressed levels. Data from Gurufocus shows over the past year, shares outstanding for BP actually increased. In comparison, Exxon shares outstanding have remained flat and Shell and Chevron have each lowered their respective share counts.
BP’s Debt
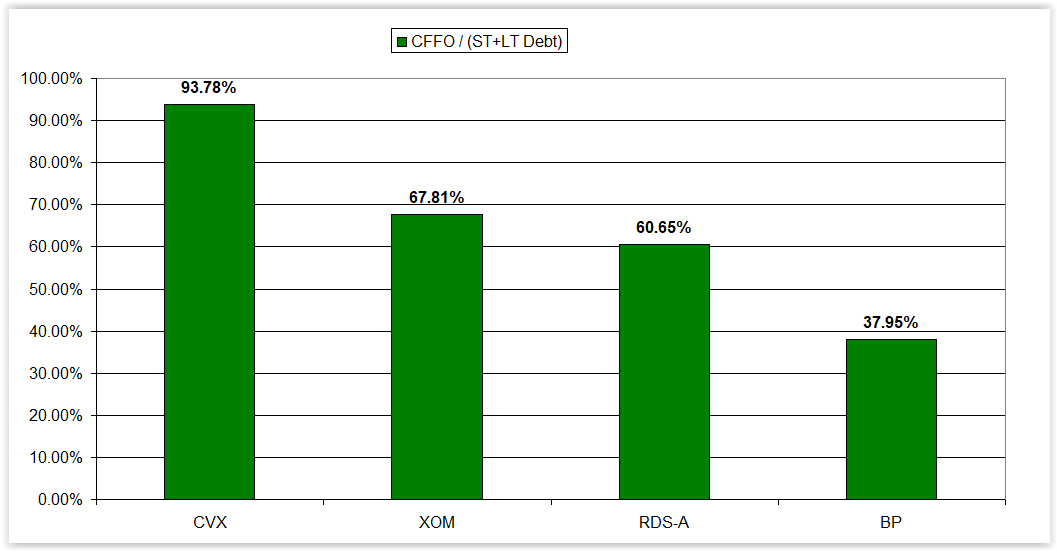
Click to EnlargeOne important metric in assessing large oil and gas companies is to examine the level of debt. This is an important step in the process given the large drop in oil prices a couple of years ago. At that time, only the companies with the best balance sheets were able to work through that time and continue paying dividends.
The way I measured debt was to examine the relationship between cash flow from operation and debt. The higher the percentage the better, because that tells me the company has either plenty of cash flow to pay off debts, or has a small amount debt. The data clearly shows Chevron is in the best position and BP is in the worst position.
Technical Analysis

Click to Enlarge
The final piece of the puzzle I will be examining is the long-term technical outlook. One of the most popular technical patterns is the head and shoulders pattern. Looking at the weekly chart below, you can see a defined head and shoulders.
For this pattern to run its course to completion would imply shares of BP trading down to around $30. With the stock currently trading at around $38.75, a decline to $30 would be a loss of 22.58%.
Bottom Line on BP Stock
After looking at the fundamentals, debt and technical outlook, I believe BP currently does not present a good value. Simply put, BP has the lowest gross margins, lowest operating cash flow debt coverage and a poor technical outlook.
In an industry faced with numerous issues, going with quality over value in my opinion is the best course of action. Out of the major oil and gas companies, Chevron and Exxon are clearly the two best choices.
As of this writing, Brad Kenagy did not hold a position in any of the aforementioned securities.