Another day, and more new all-time highs for U.S. stocks. The broad market continues to follow a trend we’ve highlighted repeatedly in this space: winners keep winning, and losers keep struggling.

If that trend continues, it will be good news for two of the names featured in Thursday’s big stock charts. For another, it’s an obvious concern.
All three stocks have a clear path to reach levels they haven’t touched in at least two years. And the charts suggest at least a real possibility that a new high — or low — will be reached. Of course, investors simply following broader trends could have guessed that themselves.
MetLife (MET)
MetLife (NYSE:MET) seems to be back on track. And with a strong rally since the beginning of this month, the first of Thursday’s big stock charts suggests a two-year high is on the way:
- MET stock has established a repeated stair-step pattern going back to October lows, with buyers stepping into every dip. That’s played out again, with the recent rally firmly establishing a multi-month uptrend. The one modest concern: a so-called “hammer chart” pattern on Wednesday, in which MET stock opened strong (the stock was up almost 2%) before fading to close at session lows. Yesterday’s trading aside, this seems like a stock headed in the right direction.
- Fundamentally, the case for upside is that MetLife has put its problems behind it. Shares touched a post-crisis high in late 2017 and then the bottom fell out. Soft guidance for 2018 initially spooked investors. Then the company announced that it was looking for some 600,000 annuity holders, leading regulators to eye the company and MetLife to disclose a material weakness in internal controls. But performance has steadily improved, capped off by a blowout fourth quarter report last week.
-
Click to EnlargeSource: Provided by FinvizIf strong performance continues, MET stock can keep gaining. Shares still trade at a sharp discount to book value, and a 3.35% dividend yield remains attractive. That suggests a path toward 2017 highs above $55, while all-time highs around $63 are in sight as well.

Henry Schein (HSIC)
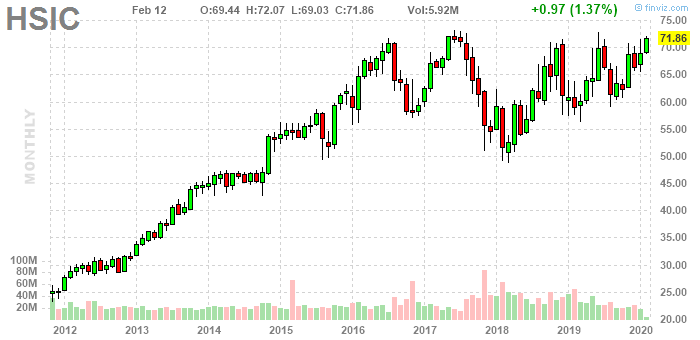
The short-term chart for dental distributor Henry Schein (NASDAQ:HSIC), the second of our big stock charts, looks bullish. The longer-term chart, however, raises one key question:
- HSIC stock is back at resistance around $72. But steadily higher lows since August create a bullish ascending triangle which usually suggests a breakout is at hand. A golden cross in November likely has played out, but HSIC still has momentum building, including a nice rally on Wednesday. Fourth quarter earnings next Friday could be the catalyst to lead the stock through resistance.
-
Click to EnlargeSource: Provided by FinvizThe long-term concern, however, is simple: HSIC has been here before. Many times, in fact. Resistance has been almost bizarrely stiff above $70 going back to mid-2016. From that perspective, the question is simple: is this time different?
- It may well be, particularly if Henry Schein can deliver a strong earnings report next week. Even with the stock struggling to clear resistance, HSIC has traded better than other medical distributors like Cardinal Health (NYSE:CAH), Owens & Minor (NYSE:OMI), and McKesson (NYSE:MCK). Those stocks have posted nice rallies of late, which means HSIC’s run, this time, might finally make it to $75.
Sealed Air (SEE)
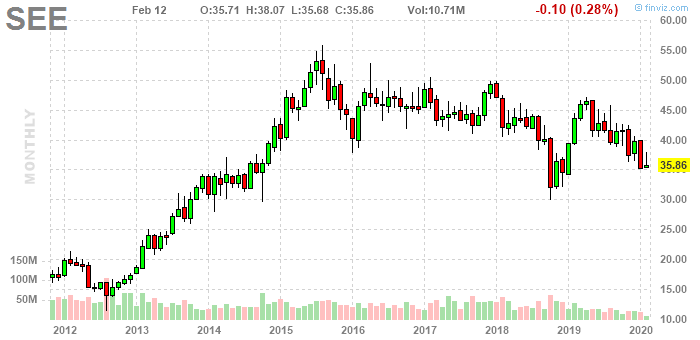
Packaging provider Sealed Air (NYSE:SEE), however, is moving in the wrong direction. After a disappointing fourth quarter release this week, the third of Thursday’s big stock charts suggests it could get worse:
- Technically, the concern with the chart is that there simply isn’t any good news. The one hope for SEE stock is that buyers step in in coming sessions, which could suggest a base about around $35. Trading going back to June does create a modestly narrowing descending wedge, which is a reversal pattern. But SEE is closer to the support line of that wedge, and trading since August looks more like a textbook downtrend.
- Fundamentally, SEE does look cheap in the right light. Shares trade at 12.4x the midpoint of 2020 adjusted earnings per share guidance released in conjunction with the Q4 report. And that guidance does suggest growth, with the range of $2.85-$2.95 ahead of 2019’s $2.82. But the maker of bubble-wrap and food packaging products is a cyclical company; earnings should be growing, and potentially at a faster rate, in a strong economy. Meanwhile, as a short-seller noted last year, Sealed Air historically has been aggressive in calculating adjusted earnings, which undercuts the credibility of that figure.
-
Click to EnlargeSource: Provided by FinvizSEE stock bottomed at $30 in late 2018, which represented a four-year low for the stock. It doesn’t seem likely, either technically or fundamentally, that shares re-test those lows. But again, struggling stocks in this market have tended to keep struggling. And there’s no doubt that SEE is struggling right now.
As of this writing, Vince Martin has no positions in any securities mentioned.