This has been one of the toughest runs for the stock market in many years. The S&P 500 recently logged seven straight weekly declines for just the fourth time since 1928 and the first time in twenty years. The Nasdaq has had its worst 100-day start to a year in history. Everything but energy seems to be in the storm’s path. That’s growth companies, retailers, FAANG stocks and more.
While FAANG is usually the go-to safe-haven for tech investors, that hasn’t exactly been the case this time around. Some of the names have held up to some degree, but for the most part, this group has been steamrolled.
A portfolio comprised solely of FAANG stocks has not held up well to the aftermath of the current bear market. From peak to trough, the Nasdaq fell roughly 32%. Alphabet (NASDAQ:GOOG, NASDAQ:GOOGL) almost outperformed the index, falling 32.8% from its high to the low. Apple (NASDAQ:AAPL) was able to, falling “just” 27.5% from peak to trough.
The rest of the group — Amazon (NASDAQ:AMZN), Netflix (NASDAQ:NFLX) and Meta Platforms (NASDAQ:FB) — did not fare as well, falling at least 46%.
As a technical trader, once support zones turned into resistance zones and uptrends failed, these stocks became toxic to me. Despite their many fundamental positives, the technicals are a mess. Can they be saved in 2022?
Let’s look at the charts.
| Ticker | Company | Current Price |
| FB | Meta Platforms | $195.65 |
| AAPL | Apple | $148.71 |
| AMZN | Amazon | $123 |
| NFLX | Netflix | $198.61 |
| GOOGL | Alphabet | $2,343 |
Meta Platforms (FB)
Click to Enlarge
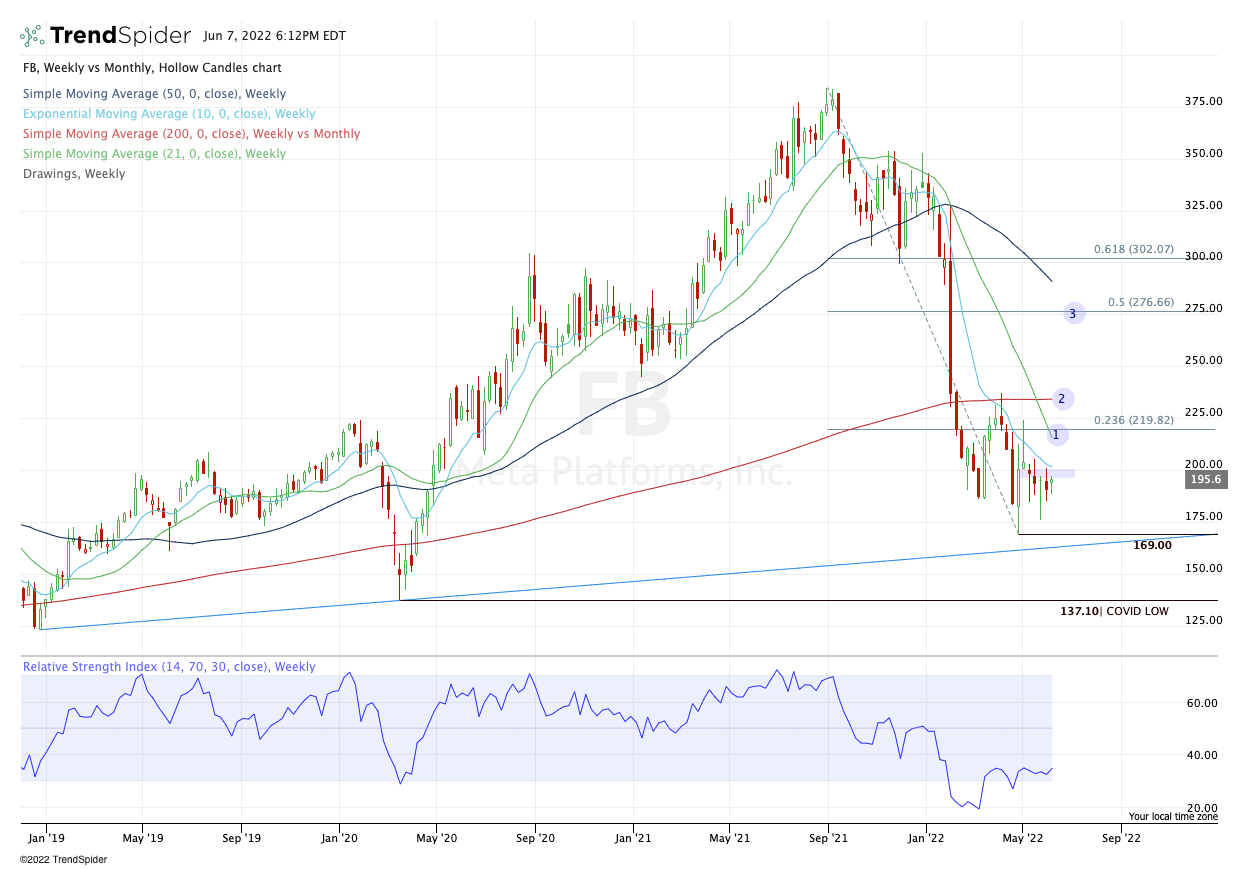
Meta has long been the “face” of the FAANG stocks, back when it went by Facebook. Short of a few overshoots down into the $170s, Meta has done a great job hammering out a bottom in the mid-$180s. While that is a positive, there are lingering concerns as well.
First — and this goes for all FAANG stocks — we still have a number of macro-related issues. Supply chain woes, lower advertising spending, high inflation, geopolitical risks and a hawkish Federal Reserve all present a risk to the stock market. That in turn is a risk for these stocks as well.
Second, Facebook stock remains below a key area: The $200 level and declining 10-week moving average.
If Facebook can clear these measures, it could open up several upside levels, including the declining 21-week moving average and 23.6% retracement, then the 200-week moving average. If it really takes off, perhaps $275 and the 50-week moving average could be in play.
On the downside, a move below $169 puts uptrend support in play (blue line). Below that and we could see a further decline to the $135 to $140 area.
Amazon (AMZN)

Click to Enlarge
Amazon gave us a potent six-day rally ahead of its stock split and briefly cleared the May high on its first post-split trading session (June 6). Now we have an interesting situation. Can Amazon continue rallying now that its stock-split catalyst is over with?
For bulls to remain in firm control, they’ll need to keep the stock above the $120 level and the 10-day. If they can do that, then Amazon has a shot at retesting this week’s high.
That said, where resistance came into play is no surprise either, as the 200-week moving average and the 38.2% retracement rejected the stock. Powering through this area could put the 50-day moving average in play, as well as the $135 area. The latter was key support several times in the first quarter. To see it reclaimed would be a huge win for the bulls.
Above this area could put the gap-fill level in play near $140, followed by the 200-day.
On the downside an eventual break of the 10-day could usher in more selling pressure. I don’t know that Amazon will retest the lows. If it does though, it’s critical that it continues to hold the $100 to $103 area as support.
Apple (AAPL)

Apple has had the most relative strength on this entire list of FAANG stocks. Yet it has barely outperformed the Nasdaq. As I look at the chart, one level is glaringly obvious: $150.
Beyond any psychological relevance, $150 has gone from prior support to current resistance. It also marks the first-quarter low. If Apple is able to reclaim this mark, we could see a push up to the $158 to $160 area.
In that zone, it runs into a plethora of moving averages — both daily and weekly — and key retracement measures. Over $163 and $170-plus is possible. After all, Apple stock does have a lot of big buyers in it, like the company’s repurchase plan and Warren Buffett.
However, if it’s rejected by the $150 level, then Apple remains vulnerable down to the $136 to $138 area. Below that and the recent low near $133 is in play, followed by a potential test of the low-$120s.
Apple is a key name to watch here. If it fails at a prior support — solidifying it as resistance — it may take the rest of the market lower. Don’t forget it still commands a $2.4 trillion market cap. However, if it can power higher through resistance, the market’s recent rally may not be finished yet.
Netflix (NFLX)
Click to Enlarge
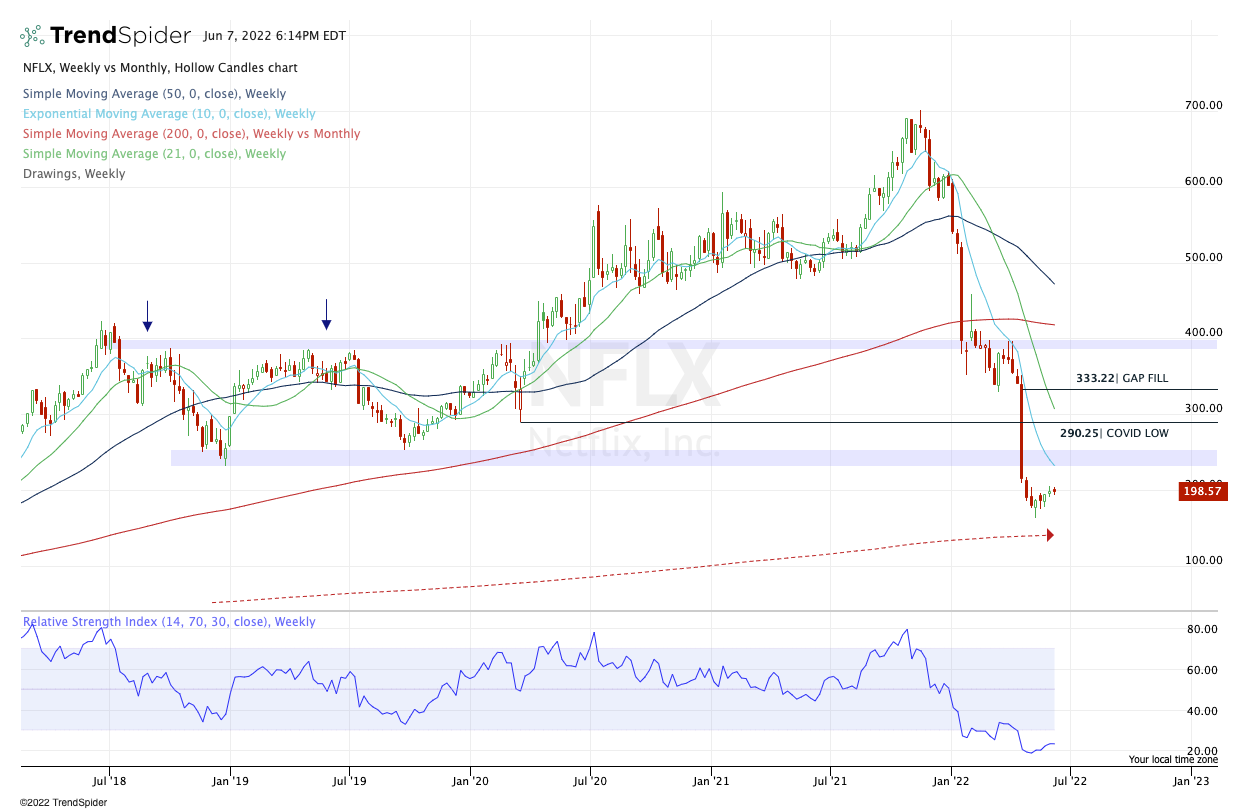
This one is tough. Netflix has come crashing down, suffering a peak-to-trough decline of 76.8%. It’s now below its Covid-19 low, as well as the key $230 to $250 area. This zone marked a double bottom in the stock in 2018 and 2019.
Now struggling to reclaim $200, investors are wondering if they can see a snap-back rally in Netflix this year. It’s possible, especially given the beating it has taken from the high.
If Netflix can clear and hold above $200, then the declining 10-week moving average in play. That’s followed by the $230 to $250 zone it failed to hold, then the Covid-19 low up near $290. It’s crazy to think that if Netflix climbed to $290, it would be up almost 80% from the low, yet still down almost 60% from its all-time high in November.
On the downside, it’s simple. Below $162.71 and the 200-month moving average is in play.
Alphabet (GOOGL)
Click to Enlarge
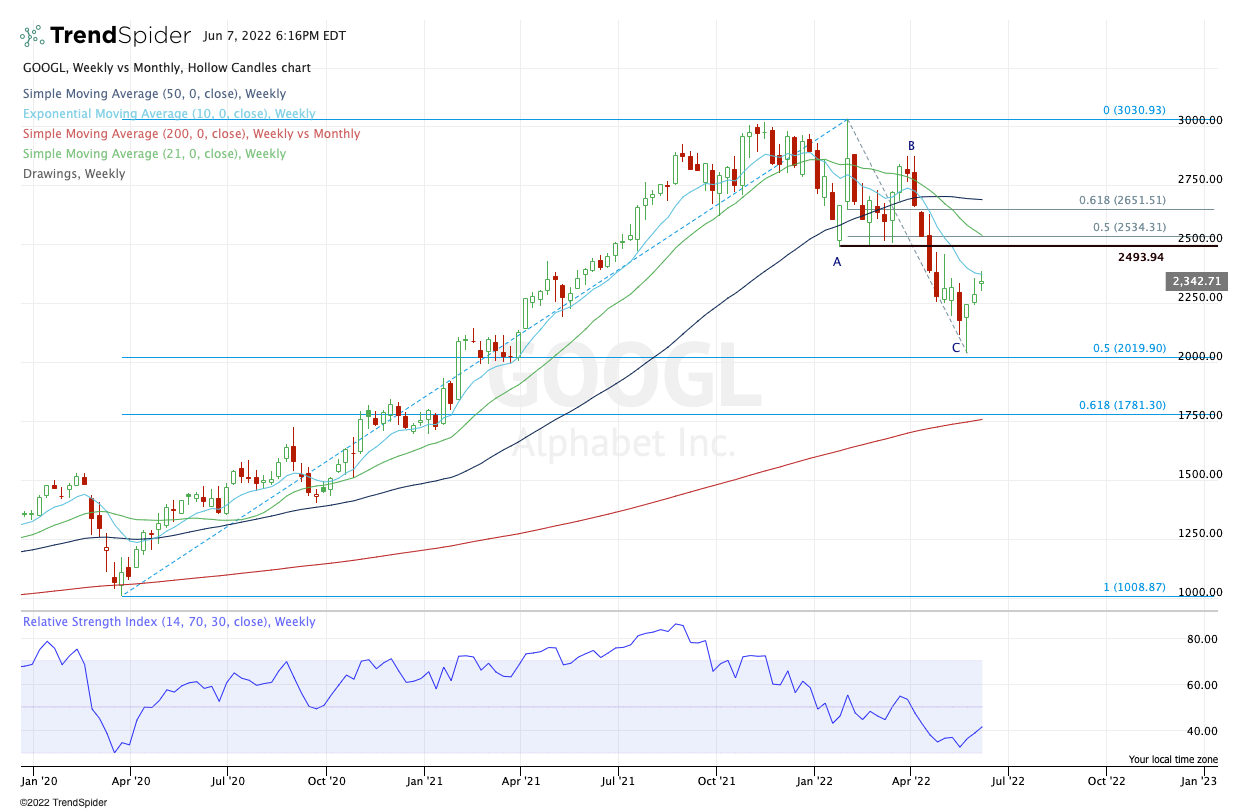
When the market was rolling over in late January, Alphabet shares rallied to new highs. That rally was short-lived though, as the stock pulled back down to support near $2,500.
After recently bouncing from the $2,000 area, Alphabet stock has yet to reclaim this critical support level that failed in mid-April. Put simply, Alphabet stock needs to reclaim $2,500.
In that sense, it reminds me a lot of Apple. If the two stocks can reclaim their two major levels together, they can help lift the market higher as well. A combined $4 trillion in market cap will obviously help. However, if both stocks fail to reclaim key support, that big market cap is going to be a negative for the Nasdaq.
Specifically, a move above $2,500 puts $2,650 to $2,700 in play. Above $2,750 and perhaps this one can make a run toward the highs, although $2,850 to $2,900 has been tough resistance thus far.
Currently, the 10-week moving average is acting as resistance. Above that and $2,500 is in play. If it can’t reclaim this moving average, $2,000 remains vulnerable. In fact, this observation is true so long as Alphabet is below $2,500.
Below $2,000 and $1,750 to $1,800 is in play.
On the date of publication, Bret Kenwell did not have (either directly or indirectly) any positions in the securities mentioned in this article. The opinions expressed in this article are those of the writer, subject to the InvestorPlace.com Publishing Guidelines.