The market got the new week, and the new month, started on a bullish if lackluster foot. After a sizable intraday pullback on Monday, the S&P 500 ended the session up 0.3%. It was an ugly win, however. There were more losers than winners, and some key names like General Electric (NYSE:GE) and Tesla (NASDAQ:TSLA) logged losses. Things could still go either way.
There’s opportunity in the meantime though, in both directions. Take a look at J M Smucker (NYSE:SJM), PepsiCo (NASDAQ:PEP) and Kansas City Southern (NYSE:KSU).
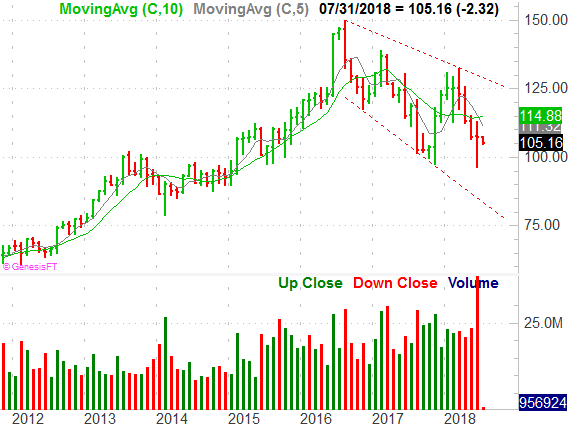
J M Smucker (SJM)

There’s something of a merger-mania underway within the packaged food industry right now, but so far, J M Smucker has been left out of it. It’s a problem simply because the struggling company needs to be part of a deal … particularly in light of the fact that its competitors are getting stronger by getting bigger. With no such deal on the horizon though, a long-standing downtrend is able to take shape.
Click to Enlarge
• The stock’s best technical chance at a reversal was the big doji-like bar from June 7 — the steep loss on high volume that started a bullish pivot. But, the fact that the turnaround effort has already petered out only makes the downtrend worse by reinforcing it.
• The 50-day and 200-day moving average lines have both acted as resistance within the past couple of months.
• The downside target, based on the falling trading range framed on the monthly chart, puts SJM in the low $80’s (and maybe lower) before the next technical low is hit.
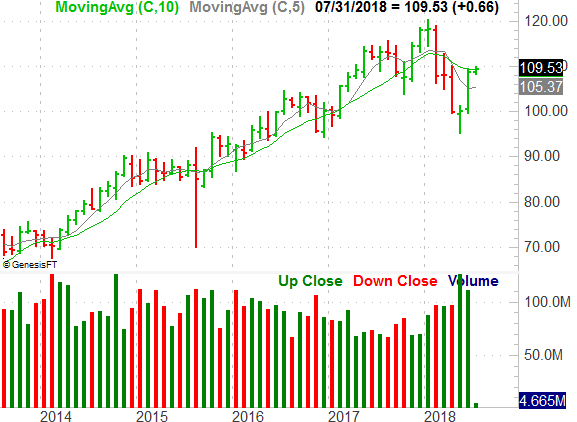
PepsiCo (PEP)
PepsiCo is still struggling with the paradigm shift toward healthier diets and away from sugary sodas — the core of its beverage business.
But, it’s finding a way to not just survive, but even thrive (a little) thanks to some innovation. It’s not the troubled name it’s so often suggested to be. In fact, the February-April pullback makes it look like a buy right now.
Click to Enlarge
• The follow-through bar (to the upside) made by June’s action confirms the reversal effort from April.
• On the daily chart, PEP shares not only cleared the 50-day moving average line last month, but fought their way above the 200-day moving average line on Monday. Both had been technical resistance earlier this year.
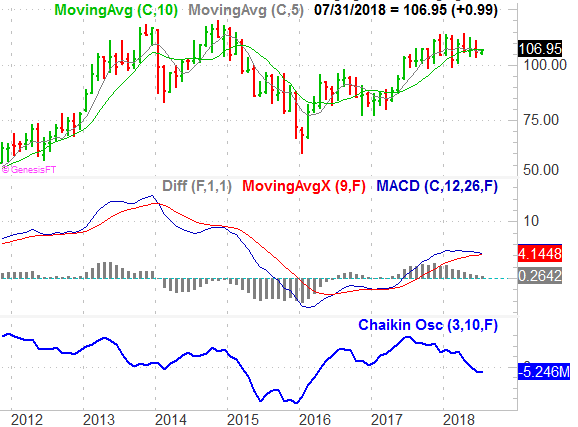
Kansas City Southern (KSU)
There’s no denying Kansas City Southern has plenty of value, with a trailing P/E of 11.6 and a forward-looking P/E of 15.2 that probably underestimates how well the railroad will do this year and next. This year has been the busiest for rail carriers for the past four, with no end in sight.
If investors are giving up on the stock though, there’s not much that can be done about it. And, they’ve given up, slowly but surely. That’s the most dangerous aspect of the stock’s recent action.
Click to Enlarge
• The 50-day moving average line is on the verge of pulling under the 200-day moving average line, giving us a so-called “death cross.”
• The slow shift from bullishness to bearishness is more apparent on the monthly chart, where we’re just one bad day away from a bearish MACD cross. It’s on this chart we can see that KSU shares are no stranger to drawn-out selloffs.
As of this writing, James Brumley did not hold a position in any of the aforementioned securities. You can follow him on Twitter, at @jbrumley.
Legendary Investor Louis Navellier’s Trading Breakthrough
Discovered almost by accident, Louis Navellier’s incredible trading breakthrough has delivered 148 double- and triple-digit winners over the last 5 years — including a stunning 487% win in just 10 months.
Learn to use this formula and you can start turning every $10,000 invested into as much as $58,700.
Click here to review Louis’ urgent presentation.