Inspired by more news that China was once again willing to talk productively about trade with the U.S., and inspired by Thursday’s bullishness, the buyers kept busy again on Friday. The S&P 500 advanced another 0.33%, with the closer of 2850.13 leaving behind a solid — even if not enormous — gain for the week.
The market’s best and worst stocks on Friday were familiar names. Tesla (NASDAQ:TSLA) fell nearly 9% in response to an interview with CEO Elon Musk that could only be categorized as alarmingly odd. Meanwhile Advanced Micro Devices (NASDAQ:AMD) gained 2% because investors simply felt like it.
Neither make for particularly great trading setups to start the new week … too much volatility, and too much uncertainty. Rather, it’s stock charts of Kroger (NYSE:KR), Intuit (NASDAQ:INTU) and Capital One Financial (NYSE:COF) that offer the most potential. Here’s why.
Kroger (KR)

Last year wasn’t a great one for Kroger, with Amazon.com (NASDAQ:AMZN) getting into the business via its acquisition of Whole Foods. It was also a tough one simply because food prices weren’t advantageous. KR shareholders suffered, along with owners of most food producer names.
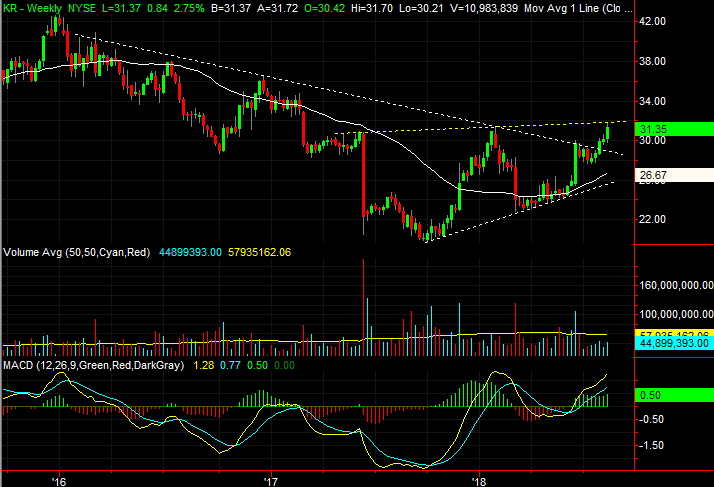
As it turns out though, even with Amazon in the picture, things haven’t been as bad for Kroger as first feared. Food prices are getting healthier too. The end result is a recovering stock that has recently broken a key technical ceiling and is ready to test the waters of higher highs.
Click to Enlarge
• As the daily chart indicates, however, KR shares have just bumped into a technical ceiling (yellow, dashed) that has capped the major peaks since June of last year. That suggests a near-term slide is possible, even of the longer-term trend is still bullish thanks to higher lows.
• Working against the budding uptrend is the gap left behind in June. Not all gaps have to absolutely be back-filled, but most are. Either way, there’s short-term pressure working against Kroger right now. The question is when and where any selling might slow, stop, and the bulls regroup to make another high. The big line in the sand is still the yellow resistance line.
Intuit (INTU)
There’s nothing inherently wrong with Intuit. The stock is uncomfortably expensive, priced at 31 times next year’s projected earnings, but it has rallied through tougher valuations.
On the other hand, the market generally only supports frothy valuations for so long before a stock runs out of buyers. When the tide turns, those bulls often turn into bears at a pace similar to their buy-in. INTU is near, if not at, a turning point from an uptrend to a downtrend.
Click to Enlarge
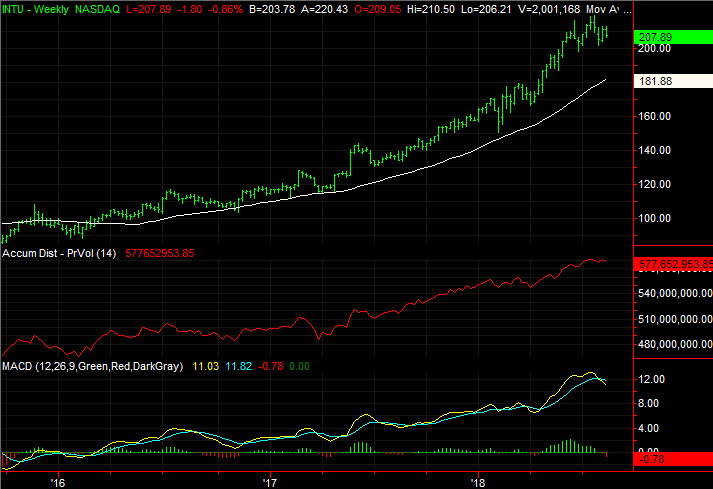
• That move follows the first major lower high (dashed, yellow) INTU shares have logged in a long while.
• Zooming out to a weekly chart, it’s not difficult to see how ripe this stock is for profit-taking. Intuit is up more than 120% since early 2016, but has become dangerously overextended thanks to the bullish acceleration since late last year. INTU was a whopping 28% above the 200-day moving average line (white) at its peak.
Capital One Financial (COF)
In late July, Capital One Financial was pegged as a budding breakout candidate. At the time, COF shares were working their way out of a downtrend and back into an uptrend. The effort got traction for a couple of days, but petered out before July came to a close.
The underpinnings never really went away though. And, as of last week, the rally appears to have been rekindled … with even a better bullish argument now.
Click to Enlarge
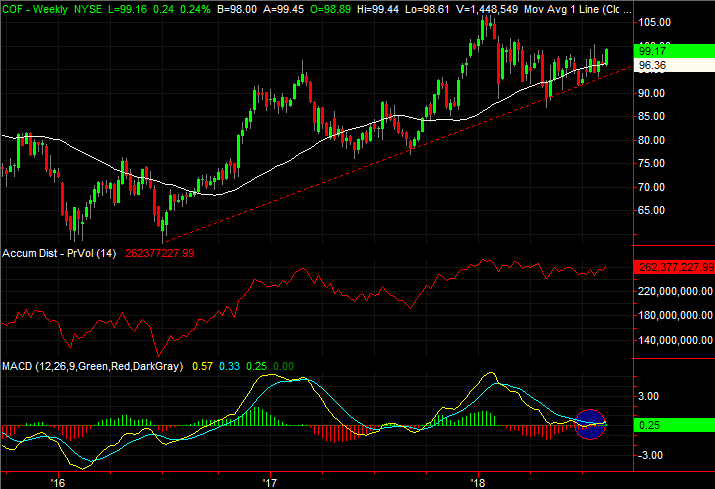
• On the daily chart of COF, there’s another, more subtle bullish clue … the convergence of all the key moving average lines. Periods of high volatility are follower by period of low volatility, and vice versa. The contraction of the stock’s movement should have set up a divergence that — so far anyway — is moving in an upward direction.
As of this writing, James Brumley did not hold a position in any of the aforementioned securities. You can follow him on Twitter, at @jbrumley.