Bingo! With nothing actually “new” serving as a prompt, the market logged another winning day on Thursday anyway. The S&P 500’s 0.78% gain left it at a record-high close of 2930.75.
Doing most of the heavy lifting was Micron (NASDAQ:MU). The memory maker advanced 2.2% during the regular-hours session, and was up another 4% in after-hours trading in response to a surprisingly healthy fiscal fourth quarter. Most other major winners were once again from the marijuana sliver of the market, though more than 70% of listed stocks logged some sort of gain yesterday.
There were losers, of course. General Electric (NYSE:GE) tumbled more than 3% on a potential design problem with its natural gas turbines, while Nvidia (NASDAQ:NVDA) was off 2% after Morgan Stanley suggested its grip on the video-gaming GPU market may not be as firm as most investors had assumed.
Heading into Friday’s trading, stock charts of Hewlett Packard Enterprise (NYSE:HPE), Lennar (NYSE:LEN) and Darden Restaurants (NYSE:DRI
) are worthy of a closer look. Here’s why.
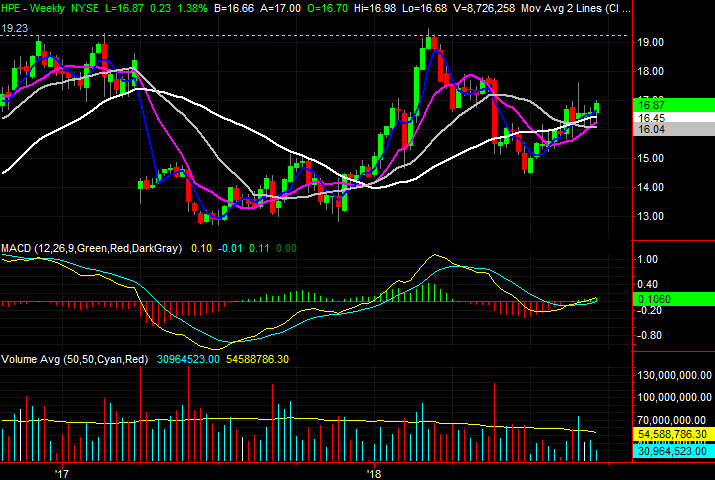
Hewlett Packard Enterprise (HPE)

In mid-August, Hewlett Packard Enterprise shares crossed above their 200-day moving average line after a short string of higher highs and higher lows. It’s usually a solid buy signal, though in the case of HPE, this volatile stock’s clues need some sort of confirmation.
That confirmation has taken shape in the meantime, with Thursday’s healthy 1.4% gain getting the stock over its last lingering hurdle.
Click to Enlarge
• The even-bigger bullish clue here is the way the 200-day line, plotted with a broad, white line on both stock charts, acted as a floor that became a pushoff point for the rally over the course of the prior three days.
• Zooming out to the weekly chart of HPE we see not only a bullish MACD crossover, we can also see there’s not any major established ceiling until you get to the $19 area.
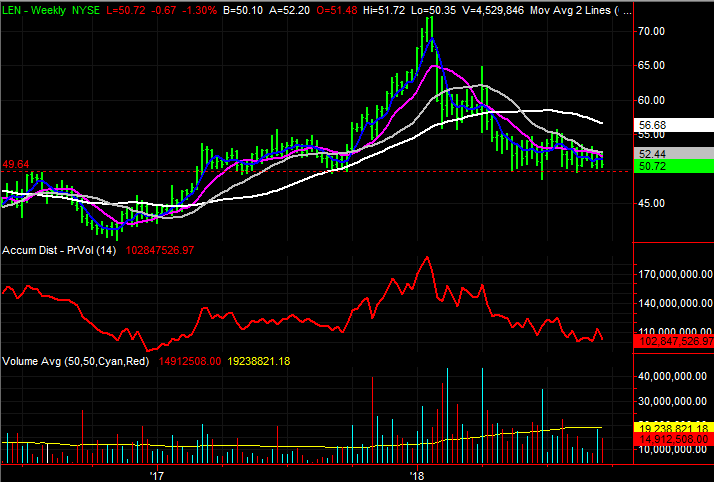
Lennar (LEN)
Between May and August, it looked like Lennar shares at least had a shot at undoing the beating they took between January’s peak and May’s low … a 30% setback. But, with the housing-construction market seemingly unable to accelerate again, no bulls have been willing to pull the trigger.
That challenge was underscored on Wednesday and Thursday, when August’s housing starts and building permits again rolled in at unimpressive levels. Thursday’s 1.3% stumble pulled the stock back to within sight of a support level that’s slowly but surely crumbling.
Click to Enlarge
• This move towards the floor at $50 is different though. This time, LEN is sitting in the shadow of a handful of failures to hurdle the gray 100-day moving average line. The bears have the wind at their back, so to speak.
• Though not perfect, the bigger-picture perspective supplied by the weekly stock chart looks a little bit like a head-and-shoulders pattern, which is a decent setup for a selloff in and of itself. The $50 level is the neckline.
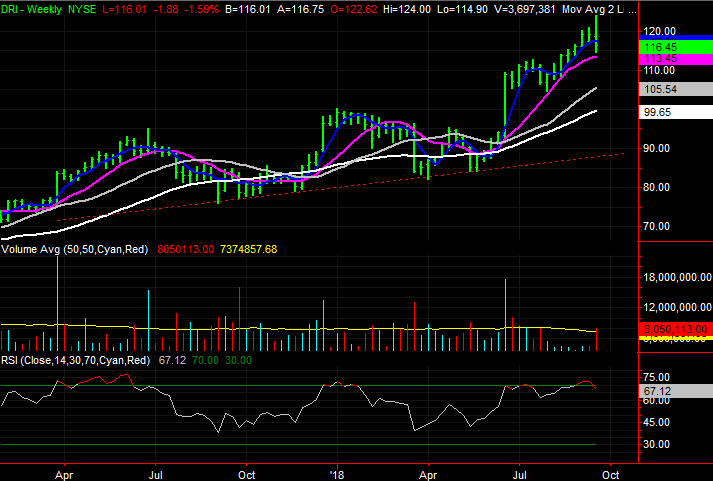
Darden Restaurants (DRI)
Last but not least, though Darden Restaurants shares were initially up on the fiscal Q1 sales and earnings beat announced on Thursday, the stock ended up ending the day in the red. That whipsaw action in and of itself is a red flag, made even more alarming by the fact that it happened after an overheated three-month rally that’s left the stock ripe for lots of profit-taking.
Click to Enlarge
• The weekly chart makes clear just how overextended DRI shares had become since pushing up and off of a support line, plotted with a red dashed line, in May. Though it gets overbought, Darden Restaurants shares generally don’t stay overbought for very long.
• The bullish gap left behind in June may need to be closed before DRI can get moving again. But, there’s also a chance that the weekly chart’s support line that’s tagged most of the major lows since August of last year may be the ultimate support line that brings any pullback to a close. Be ready for either, if any pullback gets going in earnest.
As of this writing, James Brumley did not hold a position in any of the aforementioned securities. You can follow him on Twitter, at @jbrumley.