Any lingering hopes of a renewed recovery effort were dashed on Thursday. Stocks were upended, with the S&P 500 falling to end the day back underneath its 200-day moving average line. This second wave of selling may not be as easily stopped as the first one was, now that traders realize the kind of battle they’ll have to fight just to help stocks hold their ground.
Apple (NASDAQ:AAPL) did the most net damage, with shares of the world’s biggest company sliding 2.3% lower. The selling had less to do with the company and more to do with the overall market though. Should the market slip back into panic mode, not even the top names are immune to the headwind.
It wasn’t all bad though. General Electric (NYSE:GE) shares gained 1.6% as investors started leaning toward the notion that the new CEO may be exactly what the company needs. There just weren’t enough names like GE to keep the broad market out of the red.
Mostly, however, stocks are being pushed around in both directions by an overwhelming level of uncertainty, and growing volatility. Headed into Friday’s action, it’s the stock charts of Kinder Morgan (NYSE:KMI), Danaher (NYSE:DHR) and Viacom (NASDAQ:VIAB) that look like they have the most to offer traders. Here’s a closer look at why.
Kinder Morgan (KMI)

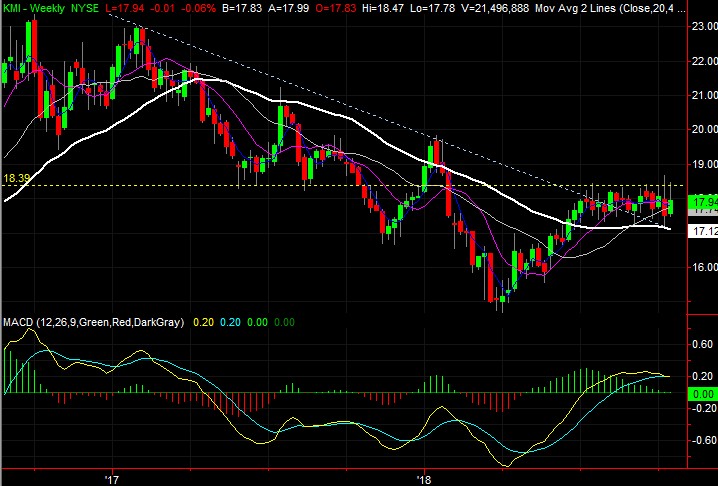
Kinder Morgan is a name we’ve looked at more than a few times of late, waiting to see if it will break above a key technical ceiling at $18.37. It did, back on Oct. 9, ultimately propelled by support from a couple of key moving average lines. That breakout move crumbled big-time the very next day though, letting KMI slide back to its last-ditch floor provided by the 200-day moving average line.
That breakout move may be a short-lived one though, setting the stage for a little more downside after all. Thursday’s intraday pullback may have just set the stage for a more serious breakdown.
Click to Enlarge
• Equally suspicious is the sheer amount of selling volume we’ve seen on recent bearish days, and the lack of volume seen with the rebound days logged over the course of the previous four trading days.
• The line in the sand is once again the 200-day moving average line, plotted in white on both stock charts. That was the reversal point a week ago, but the more it gets tested, the more apt it is to eventually break… especially now that we have a bearish MACD crossunder on the weekly chart.
Danaher (DHR)
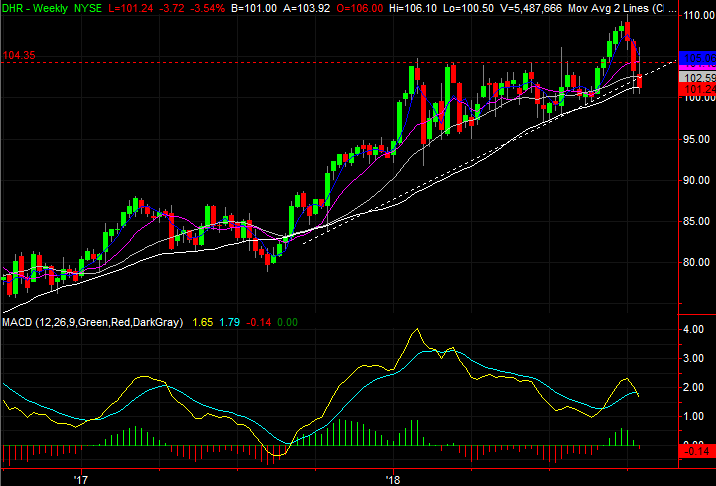
A little over a month ago, Danaher was in breakout mode, having pushed its way above a technical ceiling at $104.32. That bullish hint ended up panning out too, with a move toward the $110 area by early this month.
Much has changed in the meantime though, with Thursday’s bar serving as a huge red flag of bearishness. The stock’s on the brink of a major meltdown, and could move into that move with just one more false step.
Click to Enlarge
• Also speaking volumes is volume itself. There’s plenty of it when Danaher shares are pulling back, but little of it on days DHR has made forward progress.
• Danaher has already broken below the rising support line, plotted in white with a dashed line, though the 200-day moving average plotted with a solid white line is still holding up as a floor. For the second time in two weeks, though, the bears are working on breaking it. A close below it from here could start a wave of weakness.
Viacom (VIAB)
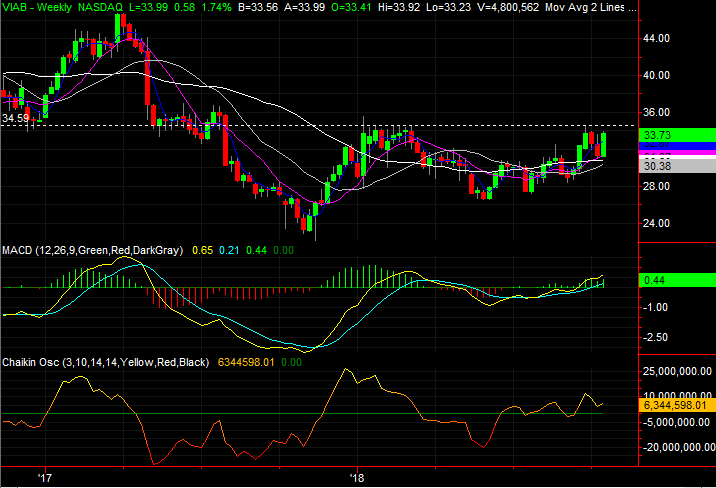
Last but not least, not all stocks are knocking on the door of lower lows. A handful of names are testing the waters of higher highs. Viacom is one of them. Though VIAB may need to move lower before moving higher, a prolonged rally may already be in the works.
Click to Enlarge
• That said, respect the fact that VIAB rises and falls on a regular basis. The daily chart’s stochastic indicator is almost back into overbought territory again, which has prompted profit-taking since June as well.
• Nevertheless, if and when Viacom shares can clear the resistance at $34.60 where it struggled at the beginning of the year, plotted with a white dashed line on the weekly chart, the stock might finally end the back-and-forth pattern and finally start to trend higher with some consistency. We won’t know for sure until it bucks the pattern for the first time.
• Once it does though, it won’t likely start doing that again without a catalyst to put it back in that mode. A revisit to the 2017 peak around $46 could be that catalyst, though that mark would also make the ideal breakout target.
As of this writing, James Brumley did not hold a position in any of the aforementioned securities. You can follow him on Twitter, at @jbrumley.