
After hearing no progress on the trade front for months, we’re suddenly being hit with a deluge of positive news regarding U.S. and Chinese trade relations. Yeah, that’s not fishy at all with the midterms just around the corner.
In any regard, it’s allowing stocks to buoy right below their 200-day moving averages, setting up the potential for major resistance should we not push through these marks next week. In that light, let’s tackle our must-see stock charts.
Apple (AAPL)

This Apple (NASDAQ:AAPL) chart likely looks familiar to many investors, given that we laid out the setup ahead of the print to InvestorPlace readers. So where do we stand now?
The truth is, Apple removed some transparency in its report and the midpoint of its guidance fell a bit short of consensus expectations. But with Buffett, and more importantly, Apple in there buying away, along with countless funds, how long can you bet against the iPhone maker?
Services hit $10 billion in sales for the quarter and continues to grow at a 25%-plus clip. The hardware maker is becoming a software and services specialist — while making big-time margins on the hardware to boot. I’m not going to pound the table on Apple’s fundamentals, I don’t have that kind of room on a piece like this.
But long story short, I want to buy dips rather than sell into the decline. We’ve broken out of the downtrend channel (purple lines) and will likely close below the 100-day. That sets us up for a retest of the 200-day.
I’m going to be honest, I’m talking my book a bit right now, but that’s only because the stocks happen to be the market’s biggest names on Friday. I’ve owned Apple for a long, long time. I couldn’t help but finally nibble some here near $207, as it rests on the backside of prior uptrend resistance (blue line).
If it breaks below that, I’ll be looking for a $190 to $195 test and to be honest, I really hope it happens.
Starbucks (SBUX)
The other half to my book-talking special? Starbucks (NASDAQ:SBUX). It’s my largest single-stock holding as well as my longest tenured position. I couldn’t help but point out the relative strength constantly on Twitter, as well as here on InvestorPlace — actually, we nailed it here — as Starbucks continued to outperform last month. Shares actually rose in October, before exploding higher on earnings.
So what now?
After nearly hitting $66, most doubters are throwing in the towel. Bulls most certainly will want to see $60 hold as support, and even more so, $62 to $63. If we somehow get a dip down into the $57 to $58 range, investors would be crazy to take a pass.
You know Bill Ackman will buy more if that’s the case.
AT&T (T)
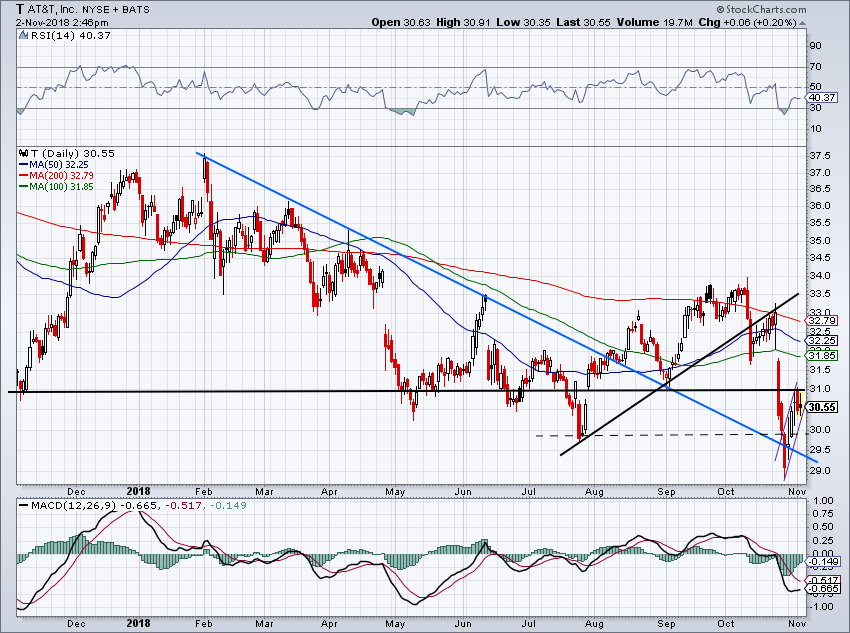
I love AT&T (NYSE:
T) for its very solid dividend, a payout it’s raised for more than 30 consecutive years. When it broke below $30 and hit $29, its yield neared 7%, a figure that has acted as support for AT&T over the past three decades. (Here’s the backstory to this dividend support).
Call me crazy, but I’m a buyer of a dependable yielder like that. But are we seeing $31 support turn into $31 resistance? That’s what its post-earnings action is looking like.
T is in a tricky spot for the bulls if they want anything more than yield out of the name. Should it hurdle $31, it has three major moving averages currently between $31.85 and $32.80. On the downside, should it break down, we could easily be looking at $30 or below.
If so, look for support at $30 and again on the backside of prior downtrend resistance (blue line).
GoPro (GPRO)
GoPro (NYSE:GPRO) snapped higher on the results from Fitbit (NYSE:FIT), but tumbled 22% on Friday from its own results. It’s now a no-touch.
Shares plunged below $5.75 support, as well as all three major moving averages. Over $6 and the story changes, but we’re far from that happening. It’s in no man’s land right now.
Weight Watchers (WTW)
Trading right near $48 and some investors are surely tempted to take a stab at Weight Watchers (NASDAQ:WTW) — especially with the stock down 30% after earnings.
I’m not so sure, though. On big down days like this, I like to give stocks a few days to settle down. If it chops near $48 and can get some buyers to step up, bulls can go long with a close below Friday’s low as their stop-loss. However, if this level gives way, $40 could be on the table. Let’s see how this one shakes out after a couple more days.
Bret Kenwell is the manager and author of Future Blue Chips and is on Twitter @BretKenwell. As of this writing, Bret Kenwell AAPL, T and SBUX.