Another tough day on Wall Street is giving bulls little reprieve as markets continue to pound longs, sector by sector. On Monday it was tech, on Tuesday it’s retail. Let’s look at some must-see stock charts before our last full trading session of the week.
Must-See Stock Charts for Tomorrow #1: Tesla
Click to Enlarge
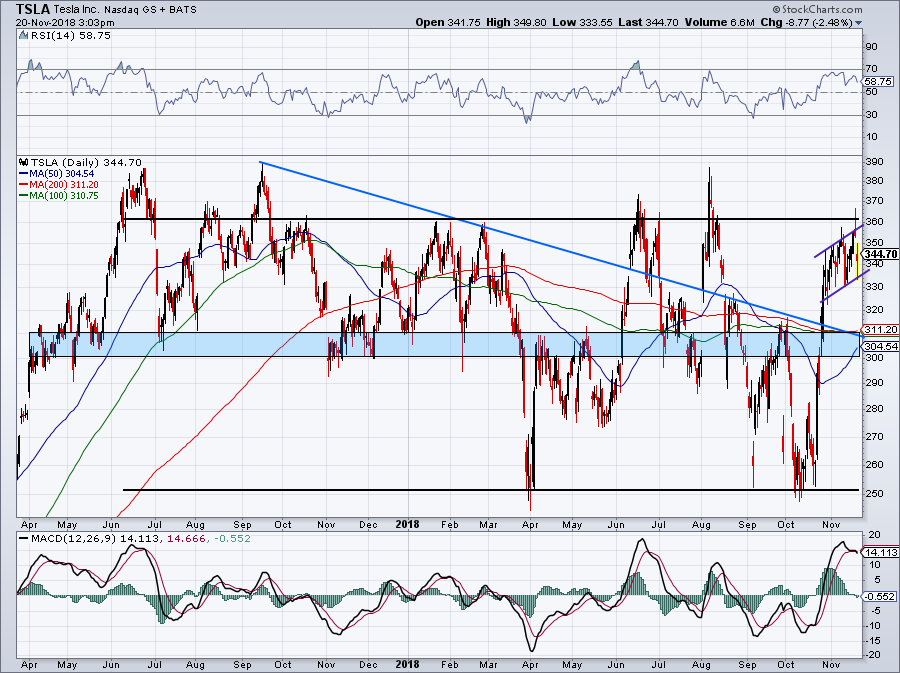
What else can we say about Tesla (NASDAQ:TSLA) at this point? The stock continues to be a beast amid a market that’s taking one hit after another.
While Tesla may be down on Tuesday, the stock is still holding up in this bullish channel (purple lines) after it was promptly rejected from the $360 level. We have covered this level many times before, emphasizing it as a point of resistance. Given the wind that Tesla has at its back right now, I wouldn’t be surprised to see this level give way.
That said, I didn’t think it would happen on its first try. Watch the bottom of channel support and the $360 level. If the latter gives way, we can get a rally to the August highs in the upper-$380s. If support gives way, There should be plenty near $310.
Must-See Stock Charts for Tomorrow #2: Kohl’s
Click to Enlarge
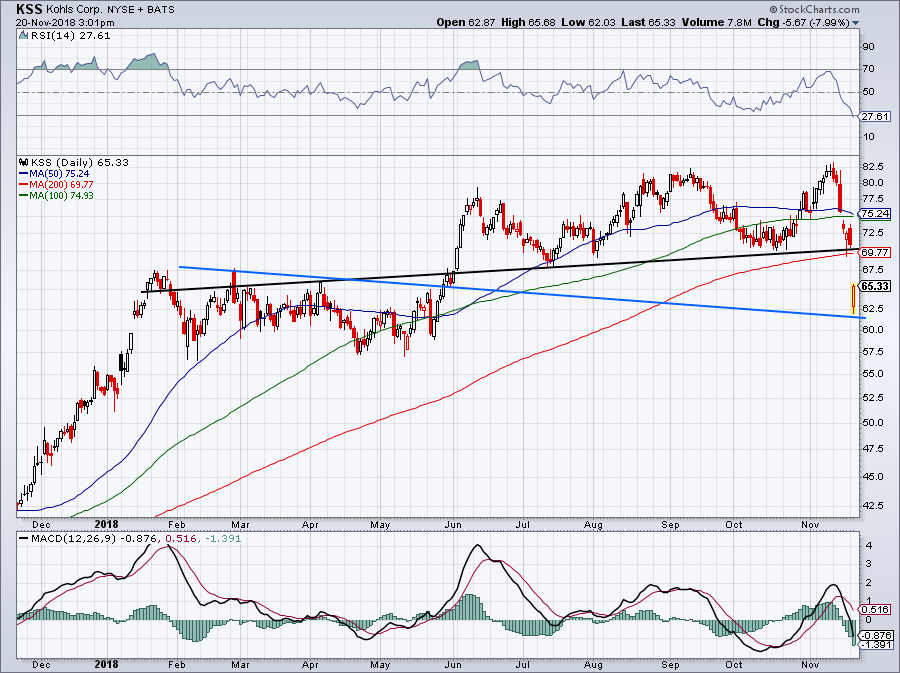
Kohl’s (NYSE:KSS) beat on earnings, revenue and comp-store sales expectations, while boosting its outlook. Its reward? An 8.5% decline on Tuesday. Given its lofty yield and low valuation, this one seems like an over-reaction.
Even worse than the decline is how badly the stock was down near the open, showing just how much investors don’t want to own stocks right now. I don’t love that shares are below the 200-day and support (black line).
However, retailers are telling a good story so far this holiday season and Kohl’s is no exception. If investors want to go long, use Tuesday’s low as the stop-loss.
Must-See Stock Charts for Tomorrow #3: Target
Click to Enlarge
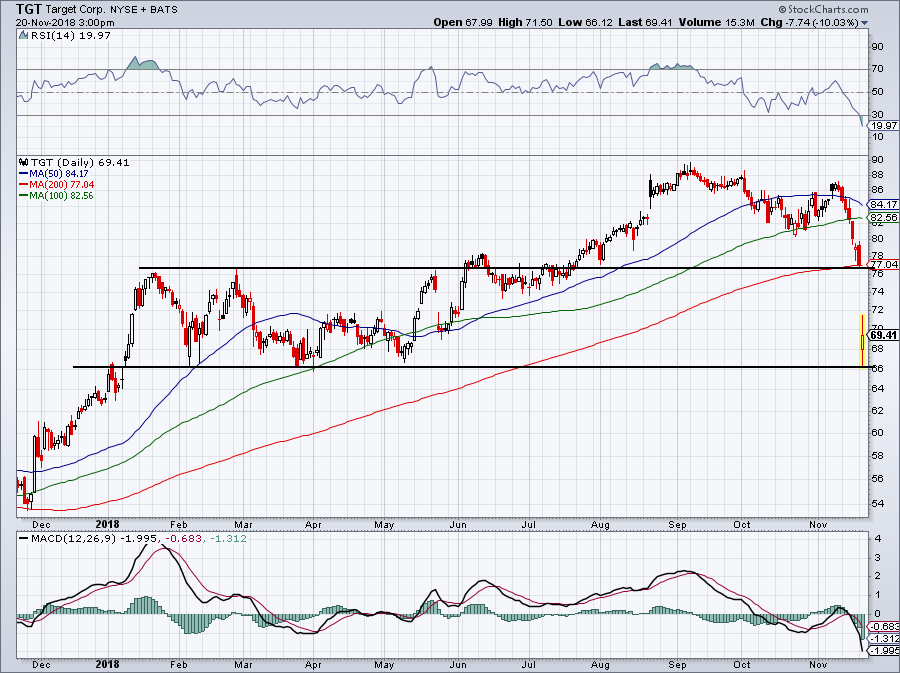
Target (NYSE:TGT) didn’t do as good Kohl’s, but it’s clear the retailer isn’t focused on the quarter-to-quarter results as it makes the necessary sacrifices to contend with e-commerce and
Amazon (NASDAQ:AMZN) over the long term.
That bodes well for investors, even though the stock is being punished Tuesday as a result after reporting earnings, down over 10%.
Like KSS, I don’t like that TGT gapped below its 200-day and support level. However, it held the bottom of its prior range near $66. Investors going long can use Tuesday’s low at their stop-loss.
Must-See Stock Charts for Tomorrow #4: Disney
Click to Enlarge
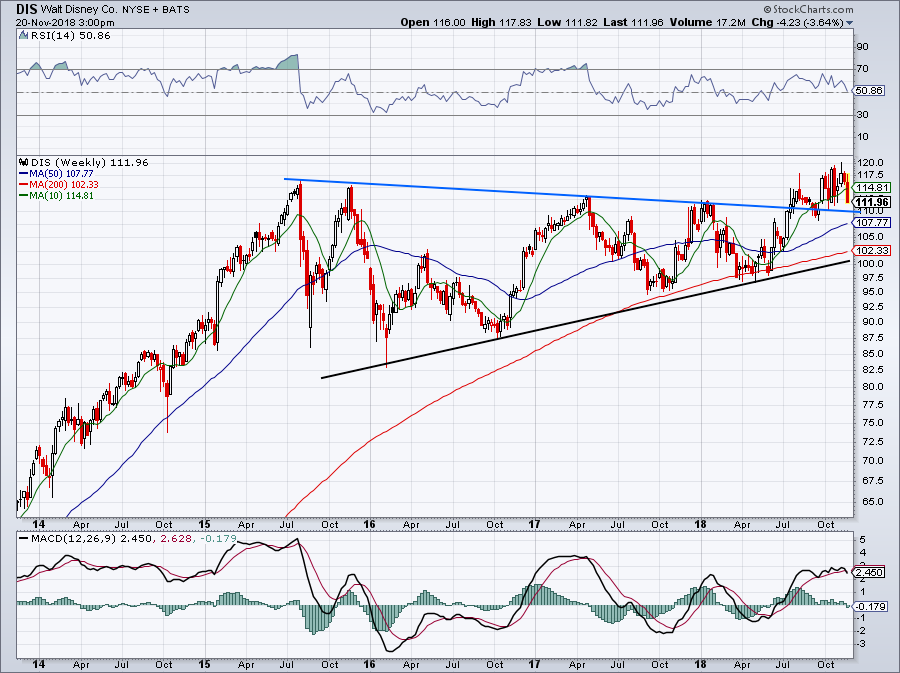
Is Walt Disney Co (NYSE:DIS) setting up as a must-buy name? Shares have held up pretty well over the past two months amid market-wide selling. It’s finally giving way Tuesday, falling 3%.
However, now under $112 and investors may want to take a closer look. Disney is now approaching the retest of its weekly breakout, currently near $110. Conservative traders may wait for Disney to shed $2 a share down to $110, while aggressive investors may consider buying near current levels and bailing on a weekly close below this mark.
Must-See Stock Charts for Tomorrow #5: Nvidia
Click to Enlarge
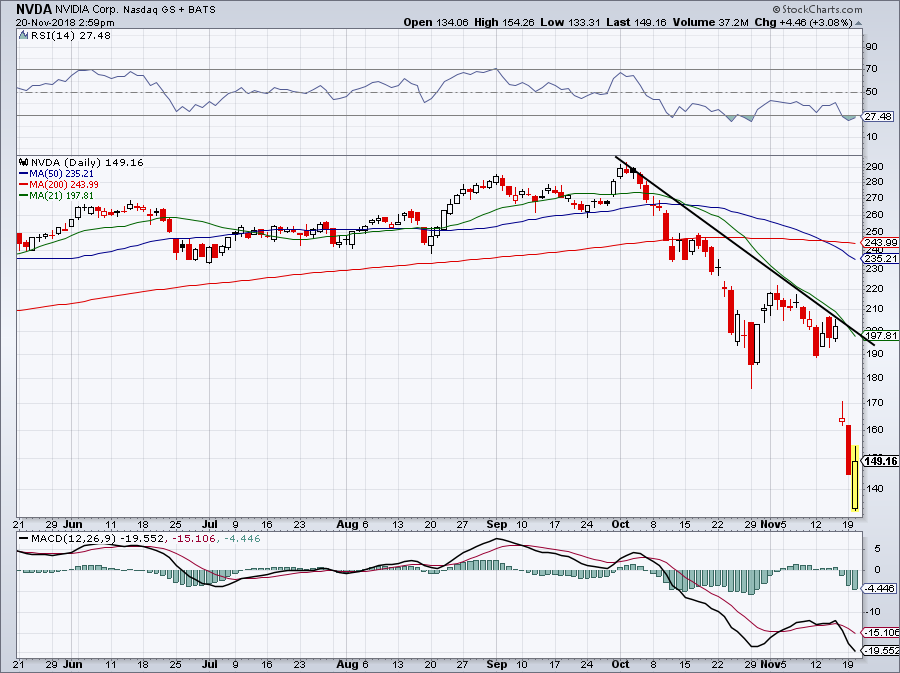
36 trading sessions ago, Nvidia (NASDAQ:NVDA) was making new all-time highs north of $290. As of Monday’s close the stock was down about 50% from those highs. On Tuesday morning, those losses spread to almost 55% as shares gapped down to $133.35 in early trading.
The stock has since recovered, rallying about 3% on Tuesday, although it doesn’t make the bulls feel much better. Even Citron Research’s Andrew Left has said Nvidia looks to have a good risk/reward near current levels.
While many eyes were concentrating on the $120 level — mine included — it may not come to fruition. At least not today. Post earnings, we said to give Nvidia a few days to shake out and it’s a good thing we did. If NVDA can stabilize near these levels, it presents an attractive risk/reward for buyers.
If it closes below Tuesday’s lows, $120 is likely on deck. But as long as they hold, a rebound to $170 is in the cards.
Bret Kenwell is the manager and author of Future Blue Chips and is on Twitter @BretKenwell. As of this writing, Bret Kenwell is long AMZN and NVDA.