
Tesla (NASDAQ:TSLA) bears are likely upset by the stock’s strong performance over the last two months. Considering that the broader-market indices are down handedly since October, the fact that Tesla stock is up about 13% from late-September must be frustrating.
But that doesn’t mean Tesla stock has seen a shortage of volatility, not by a long shot. In early October, shares were trying to push through the $310 level, but instead were demolished. Shares collapsed down to $250 in a matter of days, running into a long-term support level we pointed out at the time.
Then the automaker reported earnings earlier than expected. Skepticisms aside, the report blew away analyst expectations on nearly every metric, igniting the stock higher. It’s left a number of investors wondering what they should do now. So let’s take a look at the charts and see what both bulls and bears should be watching.
The Bullish Setup in TSLA Stock
On the plus side, bulls have been able to keep shares of Tesla elevated throughout the month of November despite the turmoil and volatility in the stock market.
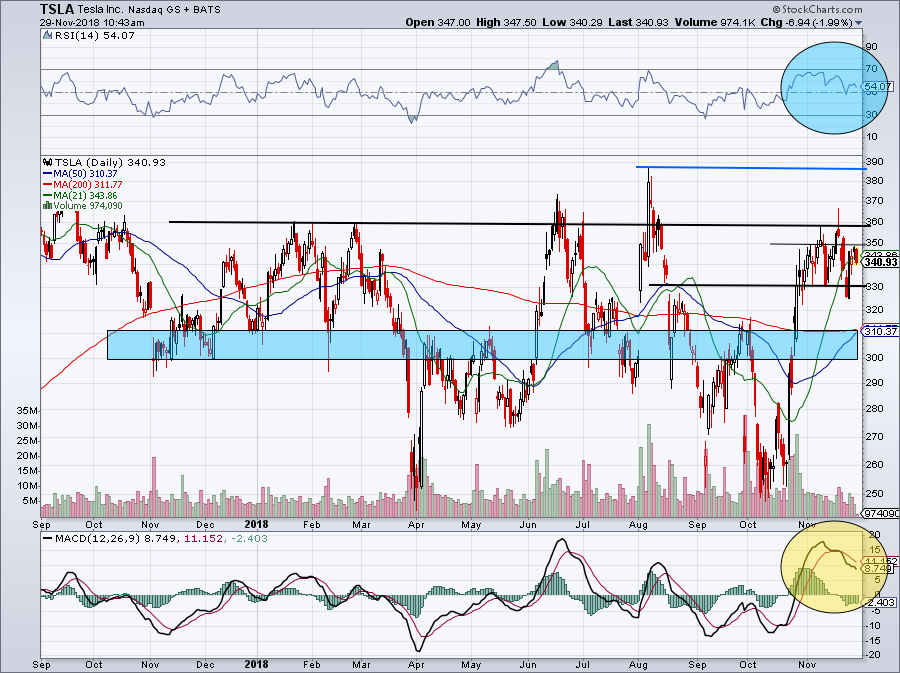
Mostly chopping between $330 and $350, we’re seeing a tight range forming in Tesla stock. On a move over $350, shares have a chance at retesting long-time resistance of $360. If it can do so again, it will put the recent highs near $390 back on the table. However, the key to the $360 breakout isn’t how high it will go, but rather, if it can stay above this level.
The longer it stays above $360, the more pressure it puts on short sellers. The more pressure the bears face, the more likely they will buy-to-cover their position. Further, the longer it stays above this mark, the more constructive it becomes for higher prices.
If we have a failed breakout, we’ll have to wait for the stock to reset to see where support comes into play.
Should we not get the breakout and the $330 level fails as support, prospective bulls can wait for a test of the $310 level. This mark is the upper level of a significant price zone for Tesla, and also marks the 50-day and 200-day moving averages. Worth noting is that the 50-day moving average could come into play before hand, acting as support as it trends higher.
It helps that the RSI surprisingly never got into overbought territory (blue circle). While the RSI may not act as much of a catalyst for the bulls, it doesn’t give the bears an edge either. Many longs may consider that a win.
Click to Enlarge
The Bearish Setup in Tesla Stock
Using the same setup as we have above, there are opportunities for the bears as well.
Just like bulls can buy a breakout over $360 or a pullback down to $310, bears can use those points as well. Those who are short now may consider using a close over $360 as their stop-loss.
Short sellers may also consider watching this level to sell into, betting against the breakout. Based on the prior 18 months, I expect bears to defend this level.
If they fail, it will only add fuel to the fire for bulls. If they succeed, it will drive TSLA stock back down to its current range.
And just like bulls are watching to see if $330 holds as support, bears can use this mark too. Below $330 and they can likely push Tesla lower for a quick trade with a solid risk/reward. While not a huge catalyst, the MACD (yellow circle) has been unwinding, which could sap some of momentum from the bulls.
The Bottom Line on Tesla Stock
TSLA offers a little bit for everyone, with investors able to use key points on the chart to their advantage. The levels that I’m watching? $360 on the upside and $330 on the downside. Above the former and below the latter could send TSLA stock to the longer-term marks outlined above.
In between and the stock can continue to chop. Whether your believe that the automaker is a fraud or that it’s changing the world, keep two things in mind: This stock is highly volatile and makes big moves in both directions, and the quarterly reports are improving, giving bulls the recent momentum.
Bret Kenwell is the manager and author of Future Blue Chips and is on Twitter @BretKenwell. As of this writing, Bret Kenwell did not hold a position in any of the aforementioned securities.