Any doubters who got out of the stock market on Thursday — or worse, shorted stocks in the midst of that weakness — were blindsided on Friday. The S&P 500 jumped 3.43% on the last day of last week, bolstering the argument that the market is ready to recover.
Apple (NASDAQ:AAPL) set the tone and the pace, bouncing back from Thursday’s plunge with a 4.3% rebound. As it turns out, investors aren’t quite so sure the company’s in dire straits after all. Netflix (NASDAQ:NFLX) had the bigger and better day, however, advancing 9.7% after Goldman Sachs said the recent pullback was a buying opportunity.
Losers were few and far between, though among the most noteworthy was Cue Biopharma (NASDAQ:CUE). Shares of the biotech stock tumbled 6.3%, though traders are still looking for a specific reason for the selling. So far, it can only be chalked up to volatility.
While the big day on Friday certainly positions most stocks for more bullishness this week, the weekend and the sheer scope of the recent gains still poses the risk of profit-taking. Fortunately, stocks charts of Gap (NYSE:GPS), Boston Scientific (NYSE:BSX) and CenterPoint Energy (NYSE:CNP
) look well positioned to move into trends regardless of what the broad market does, after several days of jockeying.
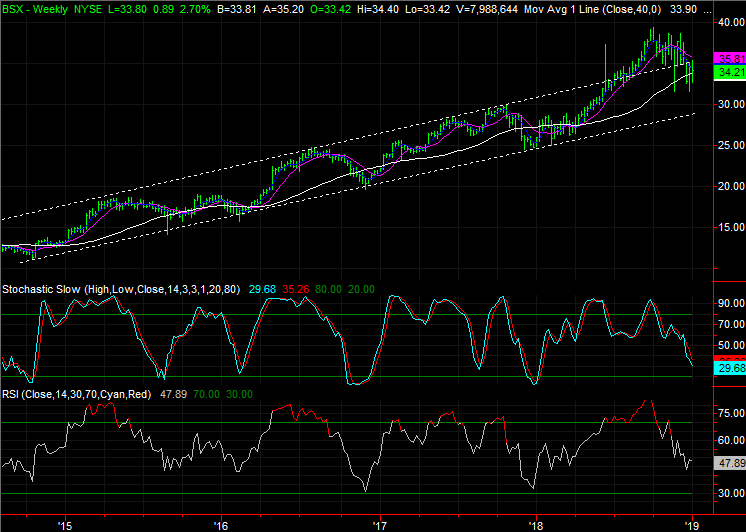
Boston Scientific (BSX)

In the middle of 2018, Boston Scientific looked unstoppable. Shares were not only in rally mode, they had broken past a major technical ceiling that had defined an uptrend that goes back to 2015.
In retrospect though, that big run-up looks like it was only a setup for an even bigger corrective move. That’s now well underway, but hardly complete yet.
Click to Enlarge
• The most plausible downside target is a pullback to the same support line that’s tagged all the major lowers going back to 2015. That level is currently at $29.00, but rising fast.
• Any major bottom should also coincide with a stochastic indicator falling all the way below 20, and an RSI indicator that gets near there. That’s the condition we saw take shape with past lows that led to recovery rallies.
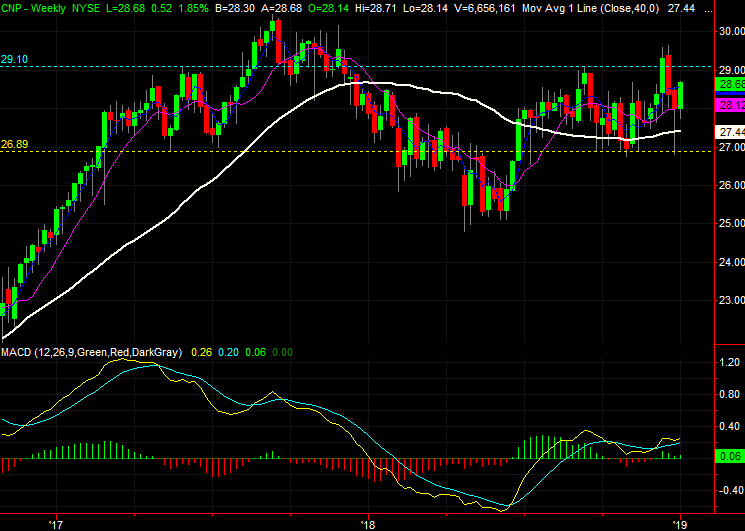
CenterPoint Energy (CNP)
The 1.9% advance utility name CenterPoint Energy logged on Friday actually trailed the broad market’s gain. But that gain is part of a much bigger breakout thrust effort that the broad market can’t boast right now. It’s unlikely we’ll see a straight shot past the make-or-break technical ceiling ahead, but the slow bullish momentum is still well-established momentum.
Click to Enlarge
• It’s evident on the daily chart, but more evident on the weekly chart that the $27/$29 span has been a trading range. The consolidation between those two lines has set the stage for a prolonged advance of $29 can be cleared.
• Underscoring the bullish argument is the fact that CenterPoint is one of the few stocks with all key moving average lines sloped upward rather than downward. It’s an indication of bullishness in multiple timeframes.
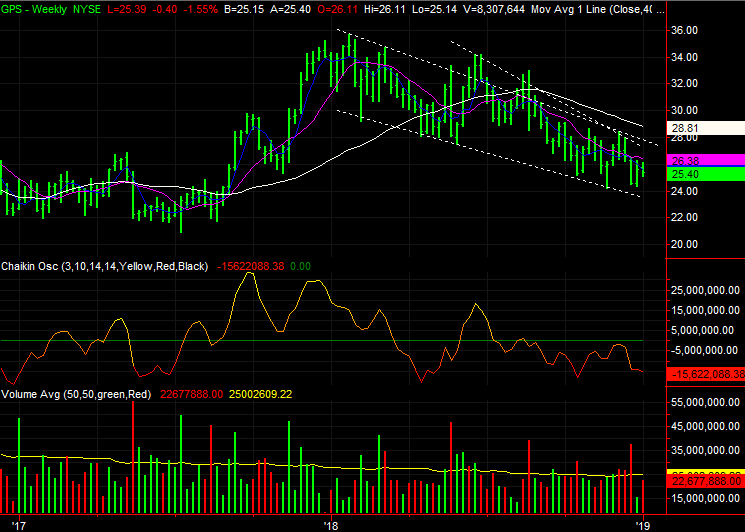
Gap (GPS)
Just because a stock loses ground on a day that the overall market moves higher doesn’t inherently make that name un-ownable. On the other hand, any stock that isn’t swept higher in a bullish charge likes Friday’s can and should raise eyebrows.
Gap is such a name, falling 1.6% on Friday and extending a well-established downtrend.
Click to Enlarge
• Notice that all the key moving average lines made bearish crosses between July and September.
• Zooming out to a weekly chart we can see Friday’s weakness is part of a well-defined downtrend that extends back to early last year. Since then, their divergences have widened.
As of this writing, James Brumley did not hold a position in any of the aforementioned securities. You can follow him on Twitter, at @jbrumley.