It wasn’t a particularly pretty effort, but the bulls managed to get the job done on Tuesday. The S&P 500 ended yesterday’s action up 0.15%, possible solidifying the recent move above the 200-day moving average line. Meanwhile, the Nasdaq finally crossed above its long-term moving average line, gaining 0.19%. Neither move unfurled on especially strong volume.
Ford (NYSE:F), amazingly enough, led the way with its 3.4% advance in response to news that it was shuttering commercial truck operations in Brazil. Walmart (NYSE:WMT) rallied 2.2% on the heels of another surprisingly strong quarterly report.
At the other end of the spectrum, Uniti Group (NASDAQ:UNIT) fell more than 30% while former parent Windstream Holdings (NASDAQ:WIN) saw its stock tumble more than 60% after a federal judge ruled that the split of the two companies violated a key covenant of one of its bond issues. The potential liability isn’t entirely clear. What is clear, however, as that investors see more than a little bit of liability in the matter.
Headed into Wednesday’s trading, the stock charts of Cabot Oil & Gas (NYSE:COG), Freeport-McMoRan (NYSE:FCX
) and Microsoft (NASDAQ:MSFT) are of the most interest. The rising tide has started to pull these names out of their respective ruts.
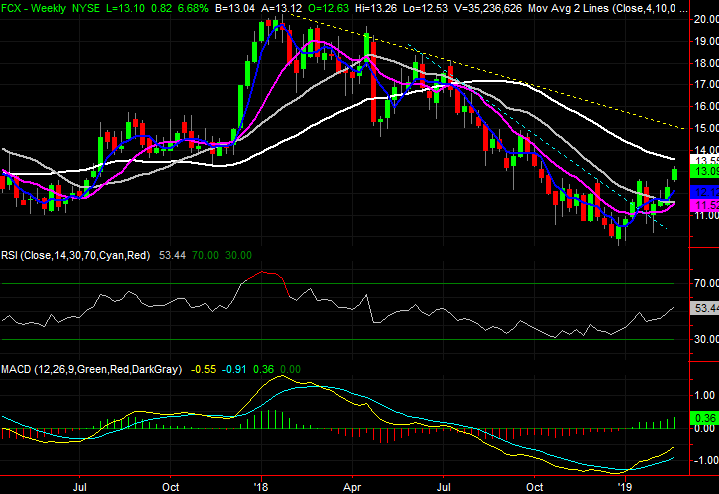
Freeport-McMoRan (FCX)

In late November, Freeport-McMoRan shares were teasing with a bounce. They’d fallen roughly 50% from the early 2018 peak, but the selling looked like it had come to a climax. Things looked like they couldn’t get any worse for FCX.
As it turns out, they were able to get a little worse. Following a small recovery effort in early December, Freeport-McMoRan ended up making an even lower low in late December. Ever since then, however, the then-oversold stock has made huge progress that suggests it has shaken off all that weakness.
Click to Enlarge
• That same daily chart, however, also shows how overextended the stock is now. At least some measure of pushback or profit-taking is in the cards.
• Even with a pullback, though, the heavy lifting has been done. We’ve seen two huge accumulation days since last week. The bulls have tipped their hand. The convergence of the gray 100-day and the blue 20-day moving average lines around $11.70 is the most plausible support area from here, should it be needed.
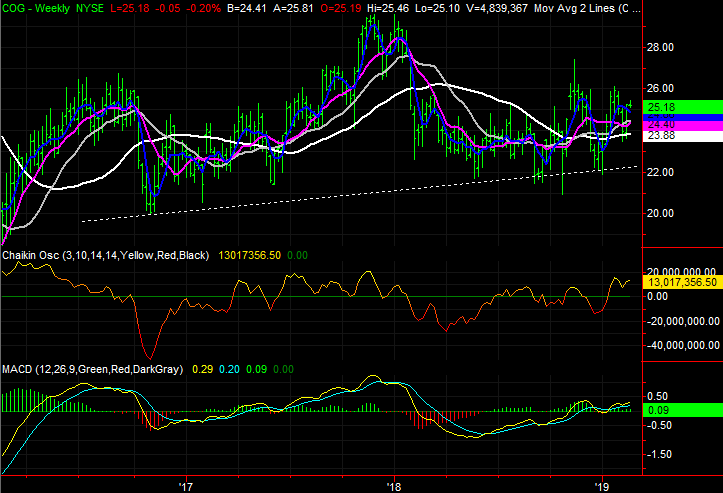
Cabot Oil & Gas (COG)
It has undeniably got more to do with the broad (though inconsistent) rebound in the price of crude than it does with Cabot Oil & Gas itself. Nevertheless, of all the oil stocks gearing up for a recovery move, COG stock is better positioned for follow-through than most.
You just have to stand back from a distance to see it, and fully appreciate it.
Click to Enlarge
• While it had to be tested multiple times, the key lows between mid and late 2018 confirm the bulls have drawn some sort of line in the sand.
• Though the bulls are chipping away at a ceiling, the brewing uptrend would be confirmed by the purple 50-day moving average starting to diverge away from the white 200-day moving average line.
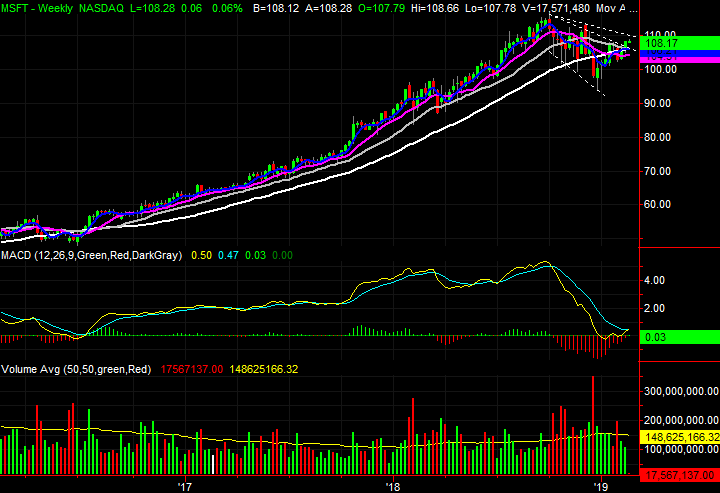
Microsoft (MSFT)
Finally, it was only a few days back Microsoft shares were hinting at another round of selling. The 100-day moving average line was acting as a ceiling, and another straight-line resistance level was forming.
That potential selloff never took hold though. Rather, it was the bulls that persisted, punching through a minor ceiling.
Click to Enlarge
• There’s still a chance the bears could roll Microsoft over. The expanding trading range, framed with white dashed lines, has established another technical ceiling around $109.00.
• Bolstering the bullish argument is the bullish MACD cross that has taken shape as of yesterday.
• Working against the budding uptrend is a distinct lack of volume, and the fact that the purple 50-day moving average line is still under the white 200-day average, and the gray 100-day average line is about to pull under the 200-day moving average.
As of this writing, James Brumley did not hold a position in any of the aforementioned securities. You can learn more about James at his site, jamesbrumley.com, or follow him on Twitter, at @jbrumley.