Stocks fell on Thursday morning but are doing their best to shake off the losses. Investors are still trying to weigh a pausing Fed and an improving trade situation with the giant rally already seen in U.S. stocks. But that still leaves a number of must-see stock charts for us to examine as the indices teeter on a potential pullback.
Must-See Stock Charts #1: Nike
Click to Enlarge
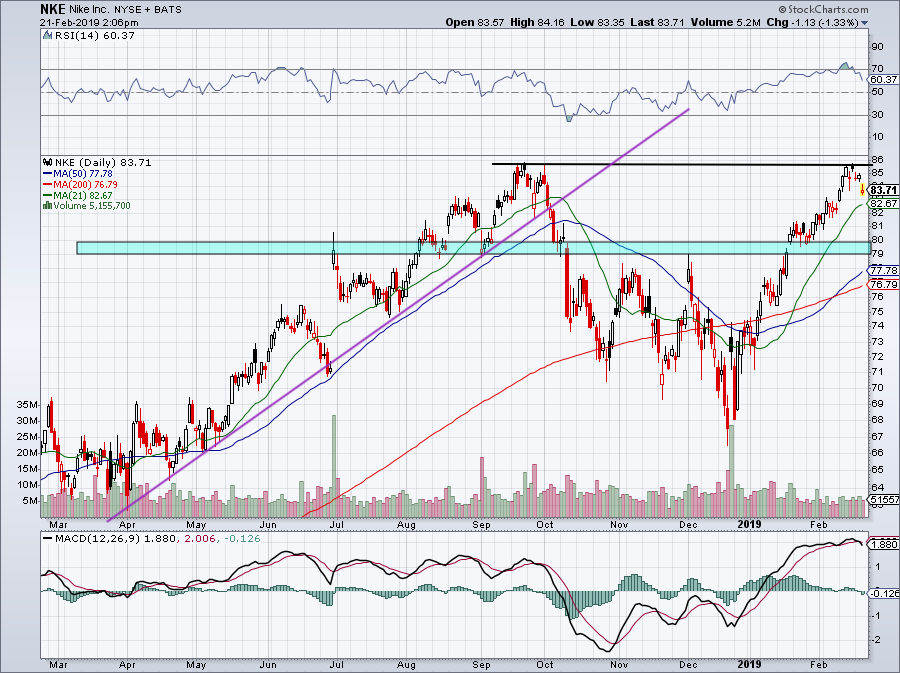
Nike (NYSE:NKE) is in the news Thursday, as its share price sinks 1.5%. But the stock’s decline isn’t the reason Nike’s in the news. Rather, the company is making headlines after college basketball’s biggest player, Duke’s Zion Williamson, had his Nike shoe “blow out” on him just seconds into Duke’s big game vs. North Carolina.
Not only did Duke lose the game, but they have lost Williamson to injury for the time being. We’ve now got Nike shares — very conveniently I might add — pulling back from resistance near $86. Sometimes the news lines up a little too perfectly.
In any regard, we’re now looking for support. Will the 20-day moving average be enough to prop up NKE? Perhaps, provided the overall market holds up too. But with the latter seemingly coming under pressure, We could see a juicy pullback in Nike down the $79 to $80 level. See how it handles the 20-day first. If it holds, a retest of the highs could be in the cards.
Must-See Stock Charts #2: Tesla
Click to Enlarge
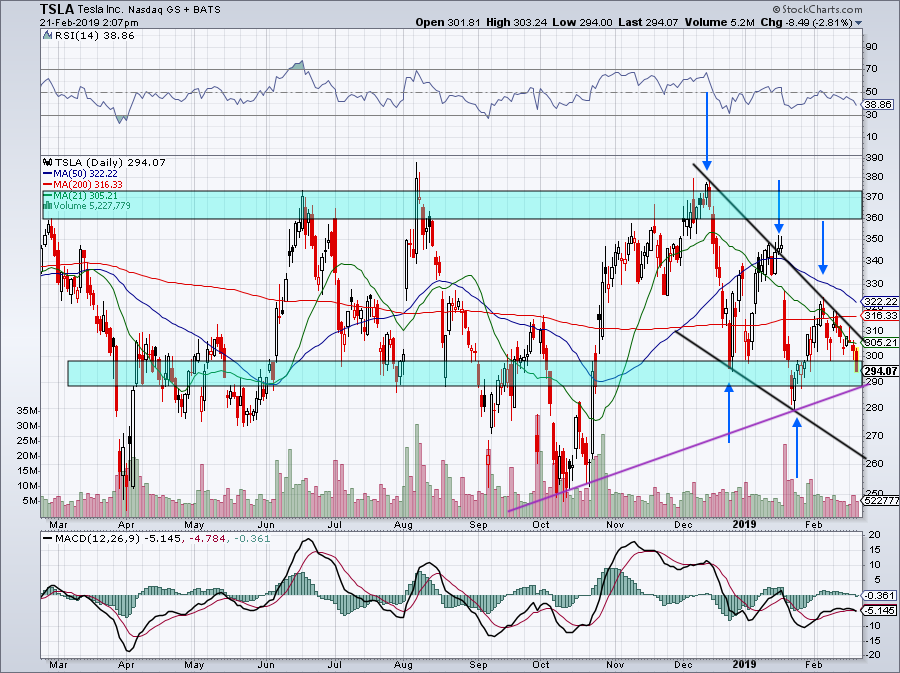
Executive departures and Consumer Reports pulling its recommendation for the Model 3 are whacking shares of Tesla (NASDAQ:TSLA) on Thursday, which are down more than 3%.
Worse though, the stock is below $300 and threatening a big-time support level at $290. This $290 to $300 area (and more loosely speaking $290 to $310) has been a very important area for Tesla.
The stock has been locked in a downtrend since early December, with higher lows and higher highs spelling out a chart that gets more bearish by the week. It doesn’t help that Tesla will almost surely close below $360 on March 1st, obligating the company to pay back its $920 million in convertible debt with cash rather than stock. Between that and a somewhat disappointing earnings result, shares seem starved for a positive catalyst.
All I can say is this: Below $290 and the $275 to $280 level is in play. But below that and we may not see the bulls make a substantial stance until Tesla’s down in the $250 to $260 range.
Must-See Stock Charts #3: Newmont Mining
Click to Enlarge
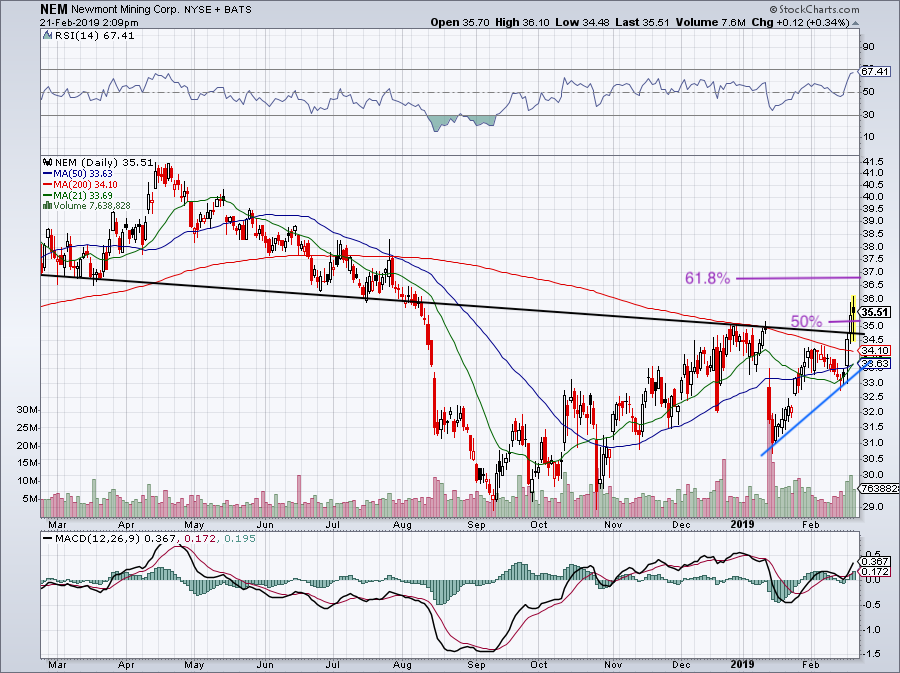
Gold has been on fire, which is giving
Newmont Mining (NYSE:NEM) some extra zest. It helps that the company reported a top- and bottom-line beat on Wednesday afternoon, leading to a modest rally in the stock.
Shares are up plenty from the January lows and NEM, at least for now, is having trouble pushing higher. Just over the 50% Fibonacci retracement level now, NEM technically has nearby support. If it holds, look for a push up to $36.67, the 61.8% retracement of the 52-week range. That level also draws in what was a rough support level in the first six months of 2018.
What happens if the 50% Fib gives way? I wouldn’t stake a huge claim to this level holding in the first place, but should it fail, there should be plenty of support below. For those that can live with a 5.5% loss from current levels, they can use a stop-loss on a close below $33.50. More conservative bulls may wait for a pullback into the $34 area to take a better/risk long position in NEM.
Must-See Stock Charts #4: Boston Beer
Click to Enlarge
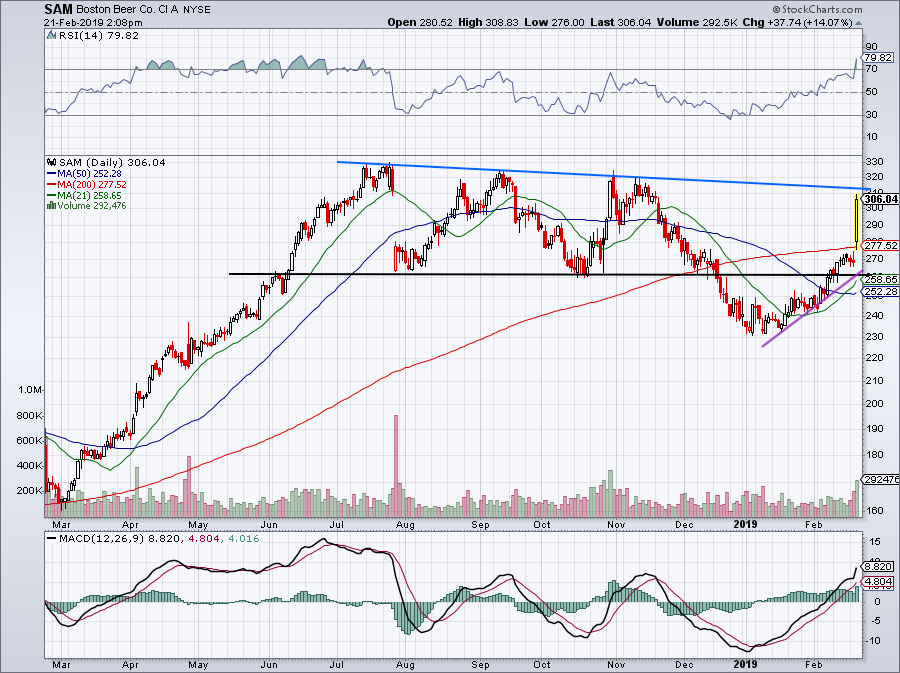
Investors are saying “Cheers!” on Thursday to Boston Beer (NYSE:SAM), which is up more than 13% after the company beat earnings expectations. While the rally is solid, SAM is sporting an RSI near 80 and coming up to downtrend resistance (blue line).
Bears can consider a solid risk/reward short bet with a stop-loss on a close over resistance. Likewise, bulls can buy on a breakout over resistance. Otherwise, the latter should wait for some consolidation and/or a pullback before getting long.
Must-See Stock Charts #5: Hormel

Click to Enlarge
Shares of Hormel (NYSE:HRL) are down 3.5% after missing earnings and revenue estimates but reaffirming its 2019 outlook. The quarter was a bit of a mixed bag and leaves Hormel’s chart showing some confusion.
Just when it looked like shares were going to breakout over $44 after having already broken over downtrend resistance (blue line), the stock has broken back down. It’s now below $44 and downtrend resistance, while clinging to uptrend support (black line).
There’s another uptrend line nearby drawn in purple, but the direction of the overall market may drive HRL in the short term. Rather than buy now, I’d prefer to see how HRL shakes out over the next few days. If buyers can get it closer to $40, it may be a worthwhile long.
Let’s see how the S&P 500 does the next few days as well, as we may get our much-need pullback.
Bret Kenwell is the manager and author of Future Blue Chips and is on Twitter @BretKenwell. As of this writing, Bret Kenwell did not hold a position in any of the aforementioned securities.