
Semiconductor stocks are often looked at as a leading indicator for stocks. While their rally has been impressive year to date, some names are now reaching technical resistance of behemoth proportions. To wit, after a 40% rally over the past few weeks, shares of Skyworks Solutions (NASDAQ:SWKS) are overbought. Bears can now look to take a stab at SWKS stock from a trading perspective.
The latest rally in Skyworks stock came on Feb. 6 on the back of the company’s latest earnings report and news that its board approved a new $2 billion share buyback program. While share buybacks most definitely can be a bullish underpinning for a stock, what’s curious about Skyworks is that they actually guided both below the EPS and sales estimates for Q2. For a stock that has rallied more than 40% since early January, that is not the kind of news I am looking to embrace by buying the stock.
SWKS Stock Charts
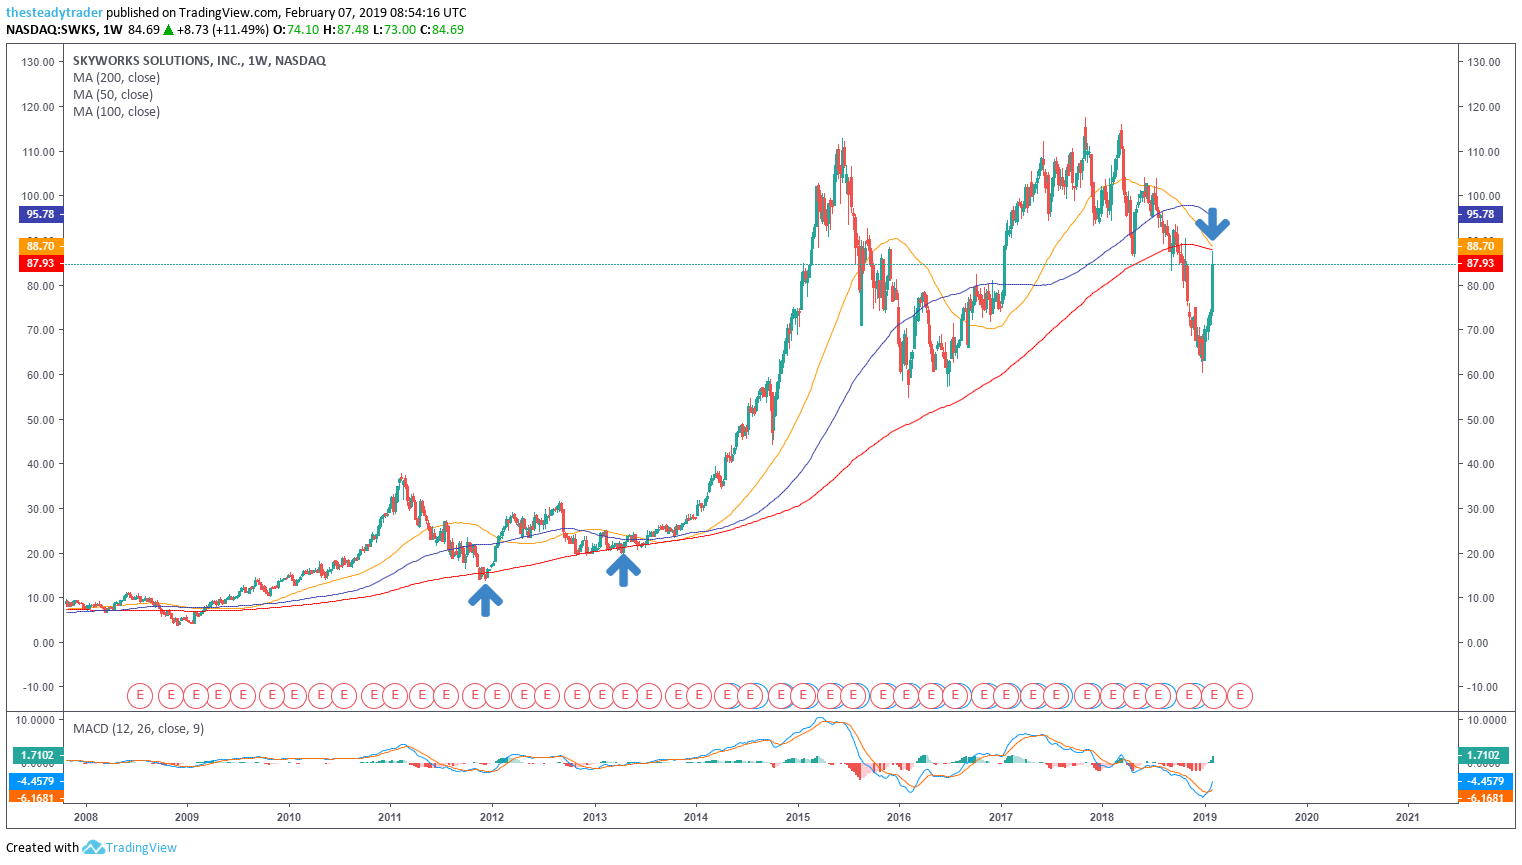
Click to Enlarge
Moving averages legend: red – 200 week, blue – 100 week, yellow – 50 week
When using technical analysis as at least part of one’s analysis of markets, I believe it is imperative not to base a trade on just one technical parameter alone. The more technical “stuff” that comes together at the same time, the better the setup. In the case of SWKS stock, as we see on the charts, lots of things are now lining up together.
On the multiyear weekly chart we see that SWKS stock in the fall of 2018 broke below its red 200-week simple moving average. If we note how well said moving average has held as support in the past, it now would not be difficult to imagine it could act as resistance. In fact, the rally from Feb. 6 ramped the stock right back into this moving average. Meanwhile and so you know, all the weekly moving averages on this chart are now pointing lower for the first time in a long time.
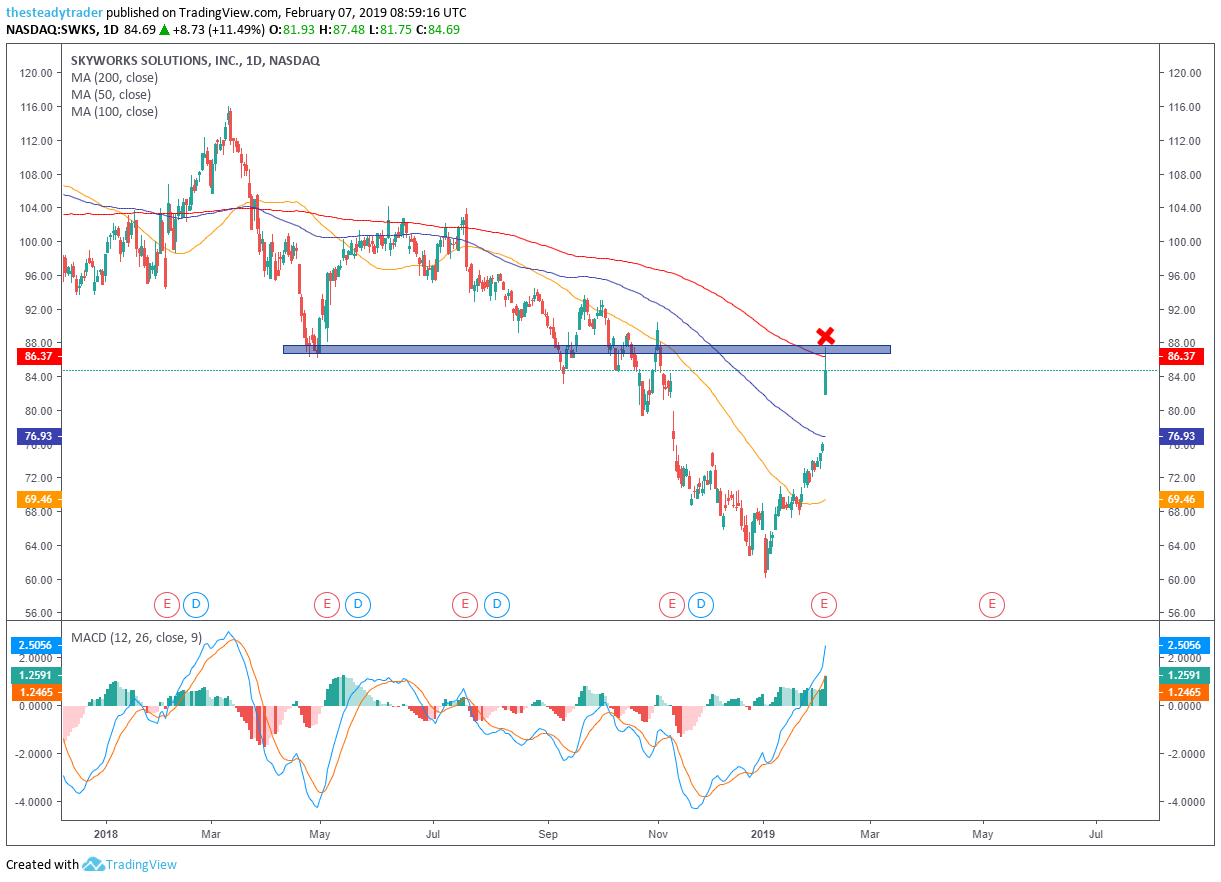
Click to Enlarge
Moving averages legend: red – 200 day, blue – 100 day, yellow – 50 day
Moving on to the daily chart, we see that the Feb. 6 rally has also pushed SWKS stock right back up to its red 200-day moving average. Note also that this rally began on a big up-gap at the beginning of the day and was added on top of an already big rally that began early January.
Lastly, from a momentum perspective as measured by the MACD momentum oscillator at the bottom of the chart, we see that the stock is overbought (to say the least).
My proprietary scanner alerted me to this trade idea at the end of the day on Feb. 6. I am holding a special webinar for InvestorPlace readers to showcase the scanner and how it routinely finds high probability trading setups. Register here.
Active investors and traders could now look to either sell short SWKS stock around the $86-$88 area with a first downside target at $80. Any push and hold above $88 area on a daily closing basis would be a stop loss trigger. Alternatively, options sellers could look to sell out-of-the-money call spreads on this stock.
Special webinar on Serge’s proprietary scanner for super high probability setups. Register HERE.