Bears are finally getting some reward for their patience on the short side, but many investors are growing frustrated with the “choppy” nature of the market right now. False breakouts and breakdowns are triggering stops left and right and that’s left many investors flustered. Hopefully today’s must-see stock charts will help investors navigate the choppy waters.
Must-See Stock Charts #1: S&P 500
Click to Enlarge
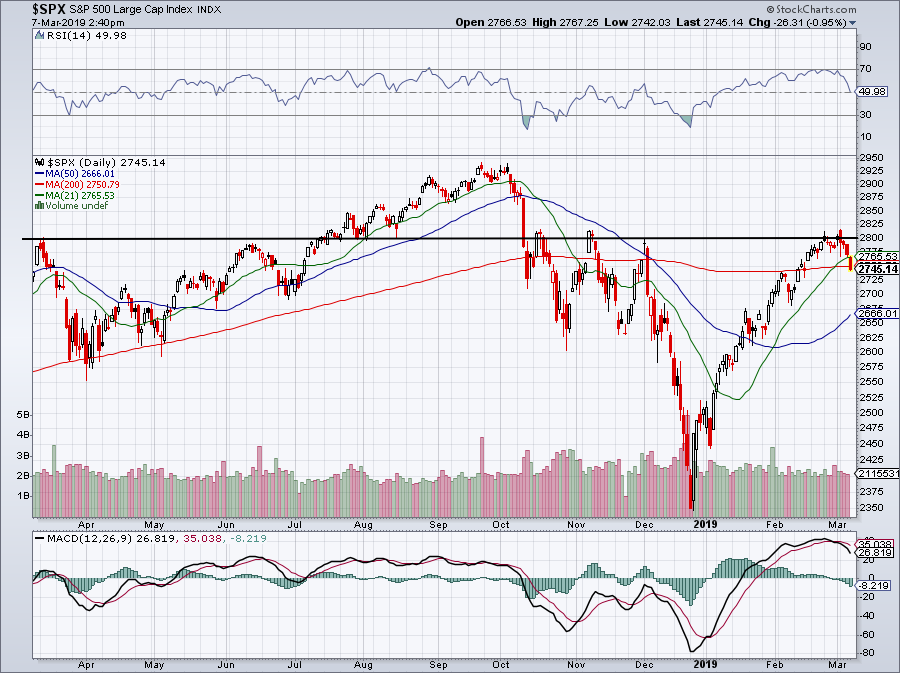
I don’t think 2,800 resistance on the S&P 500 is really any surprise for investors. At least, it shouldn’t be. We’ve been telegraphing this mark for at least a month now. However, consolidating just below it with a few false breakouts over this level gave bulls just enough confidence to stay with it.
Monday’s action was telling and we highlighted it here on InvestorPlace as well, via the SPDR S&P 500 ETF (NYSEARCA:SPY). It’s largely why many readers have been observing — being on the sidelines is a position — instead of overtrading.
So now what? The market is flushing a bit into the close and Friday’s action will be important for the next step, as we’ll get housing data and the labor report for February. It’ll be a big day and if we gap down, it may give bulls an opportunity to drive the S&P 500 higher. If it gaps up, we run the risk of fading and closer lower into the weekend.
As it stands now, the SPX is losing its 200-day and that’s not a great sign, technically speaking. Fibonacci traders are watching 2,712, the 38.2% retracement for the 52-week range. That same retracement from the December lows to the current highs doesn’t come into play until 2,635 though, about 30 points below the 50-day.
Should the selling accelerate, look for the 2,665 to 2,675 area to step up, at least for temporary support. That’s where the 50-day and 100-day moving averages are.
Must-See Stock Charts #2: Canopy Growth
Click to Enlarge
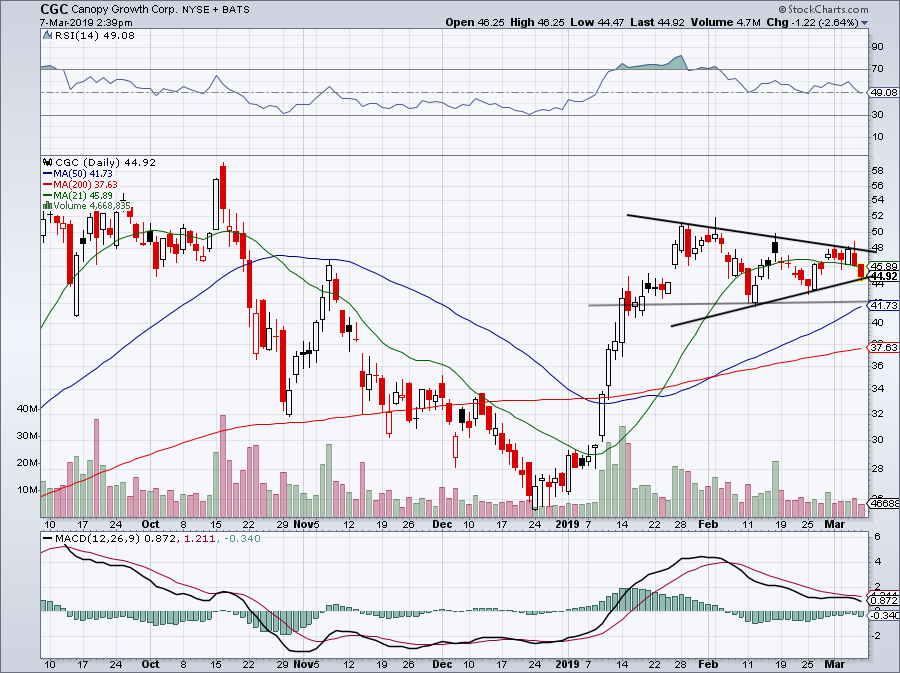
We devoted a good chunk of text to the SPX, so let’s keep it short and sweet for Canopy Growth (NYSE:CGC).
Thursday’s decline put it below the 21-day moving average, but it’s still in a tightening range. Below support and it likely sees $42, short-term support and the 50-day. A rally to resistance puts it a hair under $48. Above and $50+ is possible.
Must-See Stock Charts #3: Boeing
Click to Enlarge
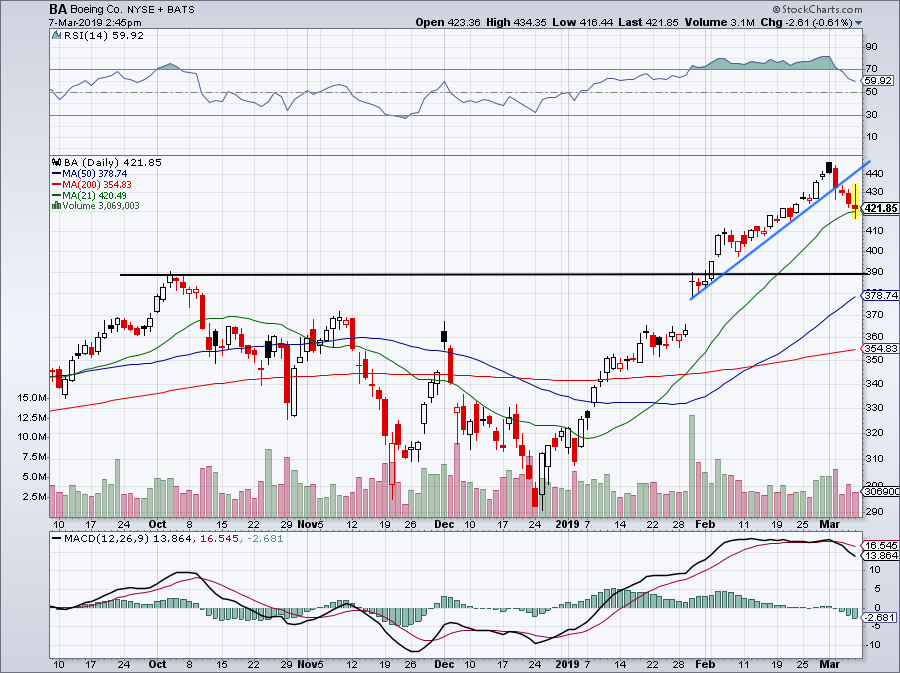
This beast is finally pulling back and, at least for now, the 21-day is holding as support for Boeing
(NYSE:BA).
A gap down and quick recovery of this level on Friday gives bulls an entry, while an open and close above the 21-day validates it as short-term support. Below and $410 is likely and $390 is possible.
Must-See Stock Charts #4: Burlington Stores

Click to Enlarge
Buried on earnings, Burlington Stores (NYSE:BURL) is down almost 13% on the day. It had all the opportunity in the world to close above $147.50, but just couldn’t do it.
While I like that the stock has posted a sweet bounce off the lows, I don’t like it below what has been a vital support area dating back to June. Over $150 and perhaps this one is okay on the long side, but the action isn’t convincing enough to jump in long at the moment.
Must-See Stock Charts #5: FedEx
Click to Enlarge
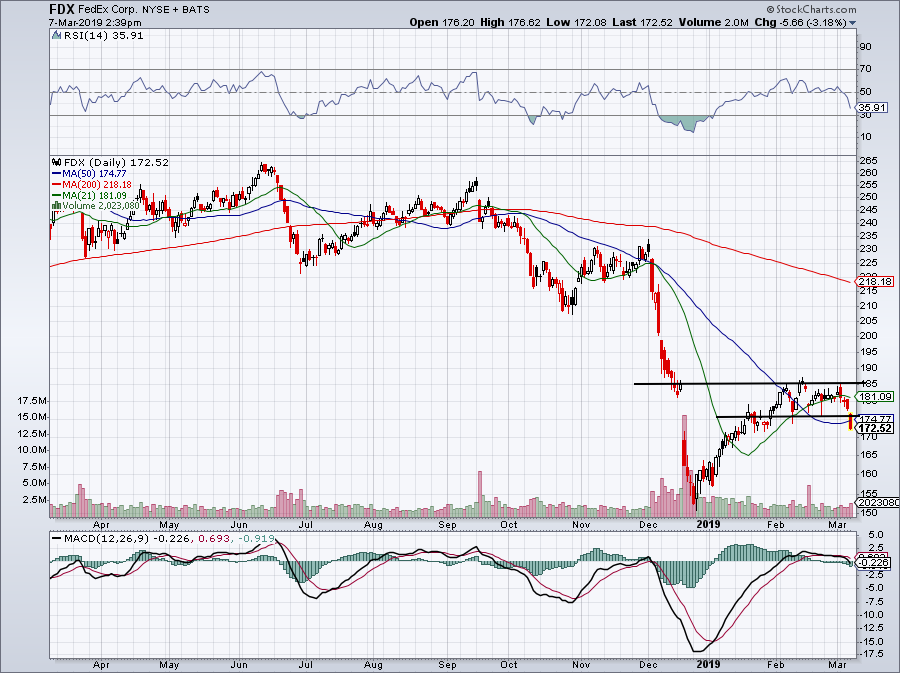
Shares of FedEx (NYSE:FDX) are getting “shipped” out. Okay, I’ll leave the lame puns for someone else, but either way, this one has been a bruiser for portfolios.
Down over 3% on Thursday and FDX is closing near the lows, is below recent short-term support and is now below the 50-day moving average. This company will report earnings later this month on March 19 and if it continues to come under pressure into the print, then it may be a worthwhile long.
As it stands now though, FDX is sort of in no man’s land from a trading perspective. Support could come in tomorrow or not again until $150. Let’s give it a few days to sort itself out before we try to make a short-term play.
Bret Kenwell is the manager and author of Future Blue Chips and is on Twitter @BretKenwell. As of this writing, Bret Kenwell did not hold a position in any of the aforementioned securities.