Stocks got the new week started on a bullish foot, with the S&P 500 rallying 1.16% on renewed enthusiasm and hope for an economic revival. The index’s close of 2,867.19 was its best yet for the year.
 Bank of America (NYSE:BAC) led the way with a 3.4% gain, though most banks weren’t far behind thanks to the inverted yield curve becoming un-inverted again. Advanced Micro Devices (NASDAQ:AMD) was up 3.3%, extending its new, young uptrend.
At the other end of the spectrum, Lyft (NASDAQ:LYFT) fell another 11.8% yesterday in its second day of trading. Shares ended the day near $69, falling below their IPO price of $72 as traders dump — or short — the newly minted stock of the so-far-unprofitable company.
Headed into Tuesday’s action, it’s the stock charts of Allstate (NYSE:ALL), AT&T (NYSE:T) and American Tower (NYSE:AMT
) that merit the most attention. Here’s why.
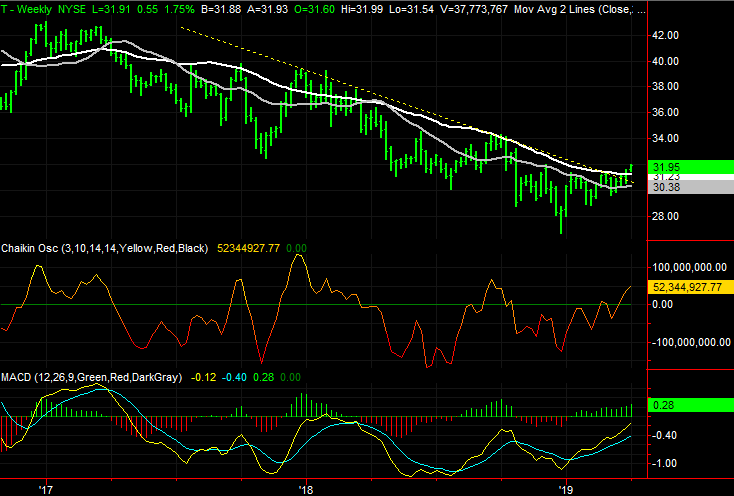
AT&T (T)
AT&T has been a miserable performer since early 2017, sliding from a price near $42 to a low of less than $27 in December of last year.
Like most other stocks, T has recovered from that deep low. However, as of yesterday shares of AT&T have snapped out of a rut and cleared not one but two important technical hurdles.
Click to Enlarge
• The other ceiling is the white 200-day moving average line, plotted in white on both stock charts. The 200-day line was a decisive technical ceiling in October, ultimately pushing T to even lower lows.
• Zooming out to the weekly chart we can see T stock has broken above a falling resistance line, plotted in yellow, that had been guiding it lower since the beginning of 2018.
• Underscoring the budding uptrend is the Chaikin line’s cross back above zero, confirming there’s real bullish interest in AT&T.
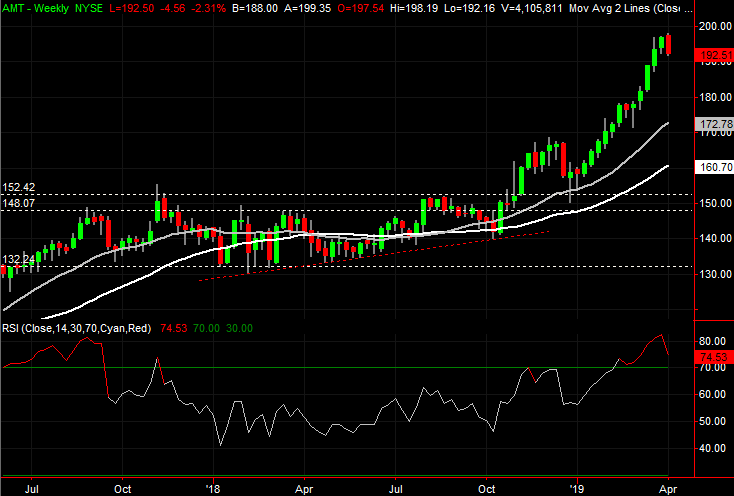
American Tower (AMT)
American Tower was one of the few names that didn’t struggle during the fourth quarter of last year, logging gains instead. And though the broad tide was bullish during the first quarter of the year, even then AMT outpaced the broad market’s advance.
That big move left American Tower overbought and ripe for a pullback. That swing from an uptrend into a downtrend may have materialized yesterday.
Click to Enlarge
• The volume surge is also a big clue. The outside-day bar on high volume suggests the last of the would-be sellers started to flood out in a big way. This might inspire more of the same.
• Potential downside targets include the white 200-day moving average line currently at $160.70, or the congestion between $132 and $152.
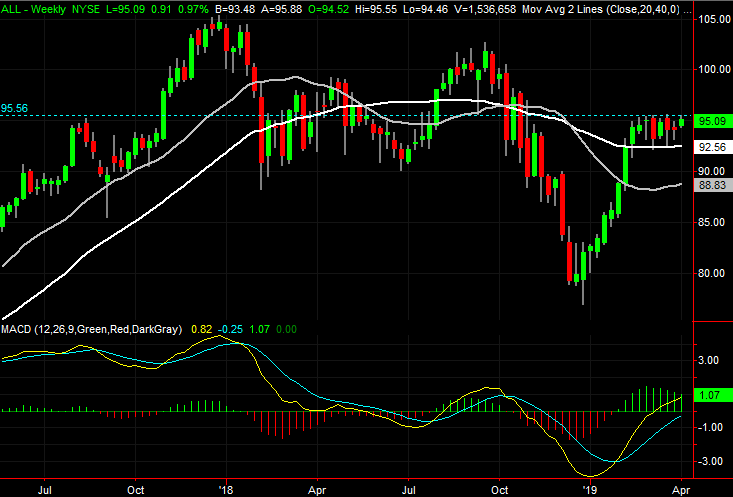
Allstate (ALL)
Allstate shares have been trending sideways for over a month, unable to clear a key technical hurdle, but also finding support at a crucial level. The stock continues to test its technical ceiling though, and some subtle clues suggest a breakout is brewing. One or two more good days could do the trick.
Click to Enlarge
• At the same time, the white 200-day moving average line has stepped up as technical support, quelling pullbacks before they get started in earnest.
• Though volume has been below average since early this year, over the course of the past few weeks there has been decidedly more bullish volume than bearish volume.
As of this writing, James Brumley did not hold a position in any of the aforementioned securities. You can learn more about James at his site, jamesbrumley.com, or follow him on Twitter, at @jbrumley.