Traders weren’t nearly as stoked about stocks on Monday as they were on Friday. In fact, the S&P 500 fell just a hair yesterday, never even really threatening to eclipse record-high levels met in September of last year.
 Goldman Sachs (NYSE:GS) was a key driver of the slight loss. Shares of the investment bank fell 3.8% following a lackluster first-quarter report. Nokia (NYSE:NOK) lost more ground, though, falling a little more than 5% after Goldman downgraded the tech company on concerns it would struggle to keep up with its competition.
At the other end of the spectrum, Bio-Path Holdings (NASDAQ:BPTH) made a huge 33% gain on news that it was not going to go through a secondary offering right now after all. With the prospect of dilution off the table for at least a while, current owners celebrated. There just weren’t enough names like Bio-Path to keep the market out of the red. Bullish breadth and depth were easily outpaced by bearish breadth and depth.
Headed into Tuesday’s trading, the stock charts of Hanesbrands (NYSE:HBI), Omnicom Group (NYSE:OMC) and Schlumberger Limited
(NYSE:SLB) are shaping up as your best bets, with budding trends that look like they’re going to take shape with or without the market’s help.
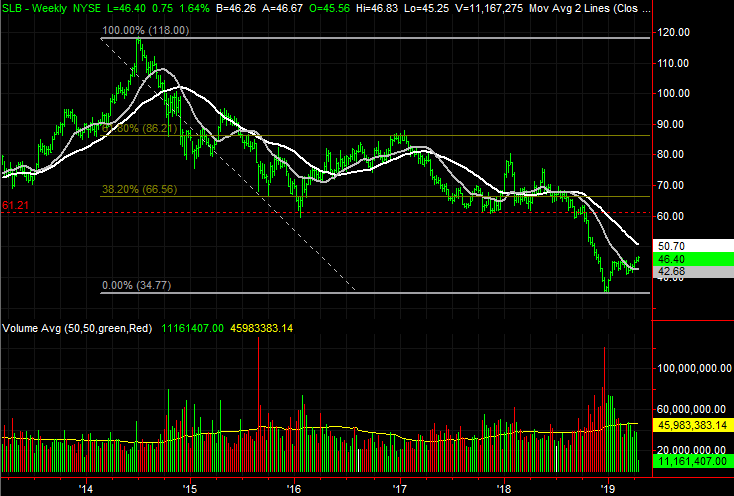
Schlumberger Limited (SLB)
The past several years have been tough ones for all oil stocks, but have been especially miserable for Schlumberger and its shareholders. Not only did SLB stock lose more ground than the average energy name between 2014 and late last year, oil’s rebound since late last year hasn’t lifted Schlumberger as much as it has lifted other stocks in the same sector.
That may be about to change this week though, at least in a modest way. Thanks to yesterday’s solid 1.64% gain, SLB is toying with a move to new multiweek highs, and there’s plenty of room to run before hitting another resistance level.
Click to Enlarge
• While not convincingly so just yet, Monday’s high-volume rally after last week’s high volume advance says there are some major buyers testing the waters.
• Should the breakout effort take hold, the next most likely upside target is between $60 and $65. That’s where a Fibonacci retracement line awaits, and where major support has been defined with a red dashed line.
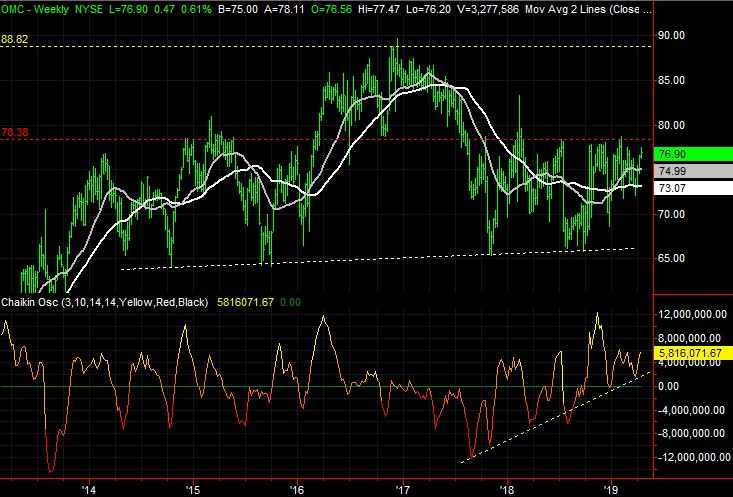
Omnicom Group (OMC)
Just a few months ago, Omnicom Group shares were teetering on a key breakdown. A technical floor around $65, plotted in white on both stock charts, was still intact, but repeatedly under pressure. On the cusp of completing a head-and-shoulders pattern, OMC was anything but a buy.
A great deal has changed in the meantime. Not only has Omnicom pushed up and off of that support level, shares are knocking on the door of a fairly important technical ceiling. A little more of the same could unleash a concerted buying effort.
Click to Enlarge
• While not yet above $78, we’re seeing more bullish volume than bearish. The broad (albeit volatile) rise of the Chaikin line on the weekly chart is telling, but yesterday’s high-volume gain further says there are would-be buyers waiting in the wings.
• Although not over the hurdle yet, should that happen, the next plausible ceiling is the late-2016 peak around $89, plotted in yellow on the weekly chart.
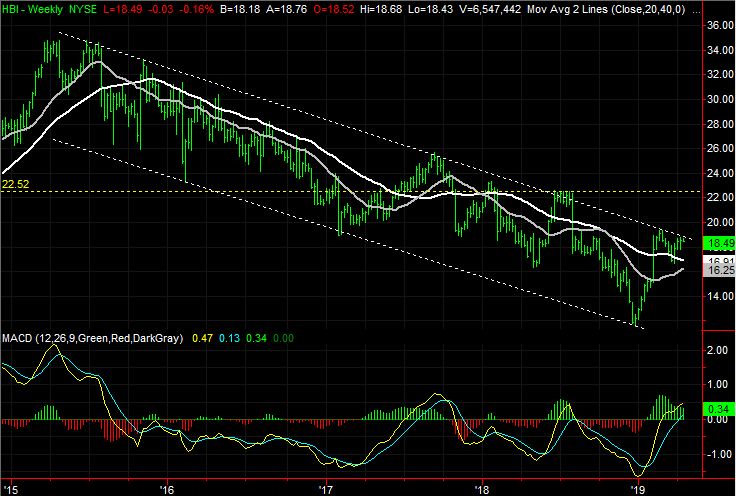
Hanesbrands (HBI)
Hanesbrands shares have been anything but a picture of consistency since 2015, but there has been a method to the madness. It has been decidedly net-bearish, but more than that, the downtrend has been decidedly well-framed. That downtrend is marked on the weekly chart with dashed white lines.
That may be about to change though. As of last week and into this week, the upper boundary of the long-term channel is being pressured. One or two more good days could do the trick and spur a wave of pent-up buying.
Click to Enlarge
• If this is all just an effort to close the gap left behind in July of last year, bear in mind there’s still a gap from February. Even a firm breakout thrust could still eventually be pressured to unwind.
As of this writing, James Brumley did not hold a position in any of the aforementioned securities. You can learn more about James at his site, jamesbrumley.com, or follow him on Twitter, at @jbrumley.