Once again the bulls managed to push stocks back off their intraday lows, but once again it didn’t really matter. Even with its close near the high of the day, the S&P 500 still ended Thursday down to the tune 0.3%, putting major pressure on the last of nearby technical support levels.

Stamps.com (NASDAQ:STMP) logged the biggest loss among the market’s major names, falling 55% after lowering its full-year guidance. That was an even bigger one-day plunge than the one shares saw in February after the company announced its partnership with the U.S. Postal Service was coming to a close. It was Intel (NASDAQ:INTC) that did the most net damage to the market though, losing 5.3% in response to a downgrade from BMO Capital Markets that lamented how long it would take for the chipmaker to turn things around.
There were a handful of winners on Thursday, though none as impressive as Roku (NASDAQ:ROKU). Shares of the streaming-video receiver company were up 28.1% after posting superb quarterly numbers that inspired a wave of analyst upgrades.
None of those names are compelling prospects headed into the final trading day of the week, however. They’re all overextended, one direction or the other. Rather, it’s the stock charts of Cardinal Health (NYSE:CAH), Northrop Grumman (NYSE:NOC) and Simon Property Group
(NYSE:SPG) that merit a closer look from technical traders.
Simon Property Group (SPG)
Most REITs have been struggling of late, so it’s no surprise that Simon Property Group shares are too. But, SPG is in more technical trouble than the average REIT is right now. One more misstep could push the stock over the cliff’s edge, with no nearby floor that’s well-positioned to stop that bleeding.

Click to Enlarge
- The make-or-break level is $171.94, plotted in red on the daily chart. That’s where Simon Property shares have found support for the better part of the past few weeks, but that support appears to be failing more and more.
- The context is more apparent on the weekly chart, but on the daily chart one can see the purple 50-day moving average line has just fallen below the white 200-day moving average line … a so-called ‘death cross.’
- The next-most-likely support tags all the lowest lows going back to February, plotted in yellow on both stock charts. It’s currently at $167.80, but sliding lower. It remains to be seen just how much of a floor that line is.
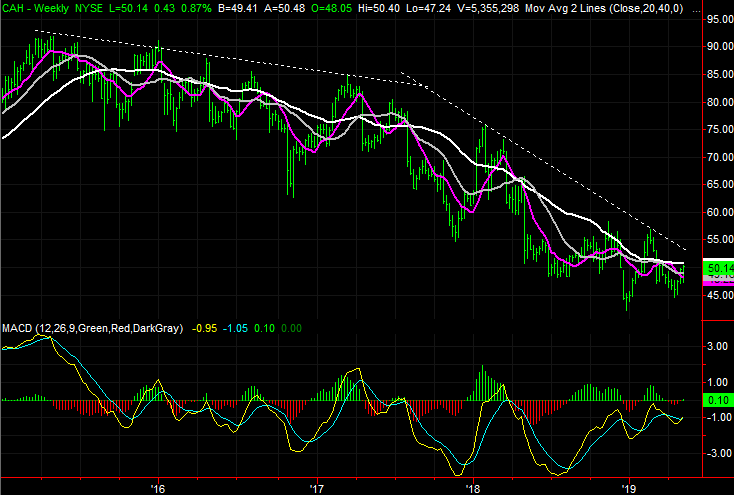
Cardinal Health (CAH)
Cardinal Health shares have been losing ground since 2015, and that pullback picked up steam in 2017. The bigger-picture selloff is still technically intact too, meaning any bullish view of CAH here must be taken with a grain of salt.
Nevertheless, a handful of subtle hints have quietly suggested the tide may have turned, and the shape — and placement — of yesterday’s bar against the market’s bearish backdrop underscores the more subtle hints that have been dropped.
Click to Enlarge
- Thursday’s open was below Wednesday’s low, and yesterday’s close was above Wednesday’s high. This bullish ‘outside day’ sparked by support at the blue 20-day moving average line says the bulls have drawn a line in the sand.
- Bolstering yesterday’s bullish bar is the volume that took shape behind it. The intraday reversal higher is a majority opinion.
- Still, while the potential rebound is enormous, the falling resistance line that’s pushed Cardinal Health lower, plotted in white on the weekly chart, isn’t yet cleared. Given the history of resistance with CAH, that reality has to be respected.
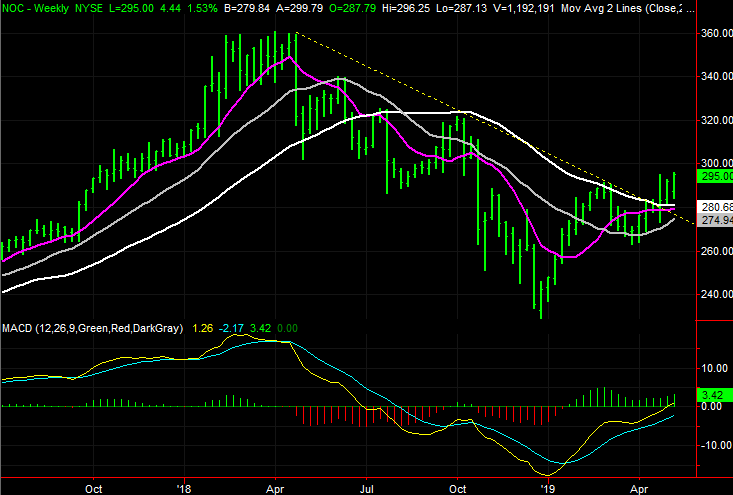
Northrop Grumman (NOC)
Last year was a tough one for Northrop Grumman shareholders, with NOC stock falling 38% from peak to trough. The stock tried to rebound early in the year, but that effort was thwarted at a pivotal moving average line.
The last couple of weeks have been notably different, however, for the better. A second effort not only cleared that key moving average line, but Northrop shares appear to have found support at other key moving average lines in the meantime. Indeed, those lines are serving as a key buy signal in and of themselves.
Click to Enlarge
- The long-term moving average line in question is the 200-day moving average line, plotted in white on both stock charts. That line was a ceiling in February (highlighted), but couldn’t hold NOC back this month.
- It’s easier to see on the weekly chart than the daily chart, but 2018’s divergence of the major moving average lines has been unwound by a new convergence. From here, a new divergence should take shape. So far it looks like it will be a bullish one.
- Also on the weekly chart one can see the critical falling resistance line, plotted in yellow, that’s been steering Northrop Grumman lower since early 2018 was finally snapped by the current wave of buying.
As of this writing, James Brumley did not hold a position in any of the aforementioned securities. You can learn more about James at his site, jamesbrumley.com, or follow him on Twitter, at @jbrumley.