After stalling on Monday and struggling on Tuesday, the bears finally got their pound of flesh. On Wednesday, the S&P 500 fell 0.65%, closing near its low for the day after a few too many investors rethought their positions after a fairly tough start to earnings season.

Railroad company CSX (NASDAQ:CSX) hit the wall the hardest, slumping more than 10% after falling short of last quarter’s earnings expectations then underscoring that miss with a disappointing outlook. Telecom technology name Ericsson (NASDAQ:ERIC) was a miserable performer too, however, down 11% after missing its quarterly earnings estimates and painting a grim picture of its business in Asia.
At the other end of the spectrum, Shopify (NYSE:SHOP) rallied more than 2% as investors jockeyed to get into the one name that could prove disruptive to the e-commerce landscape.
But none of those names are as compelling as the stock charts of Eastman Chemical Company (NYSE:EMN), General Motors (NYSE:GM) and Verizon Communications (NYSE:VZ
) headed into Thursday’s action. Here’s what makes these three names so special.
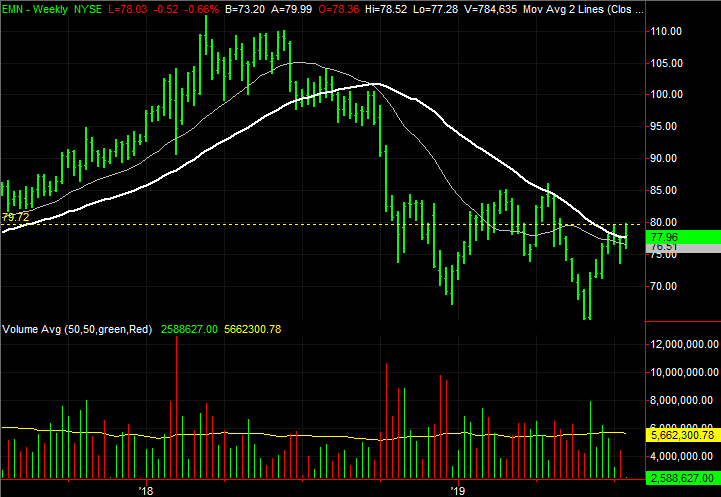
Eastman Chemical Company (EMN)
Given the action Eastman Chemical Company shares have dished out over the past couple of weeks, it would be easy to say EMN just blew its chance at clearing its 200-day moving average line plotted in white on both stocks charts. The June rally was stopped cold there, and Tuesday’s short-lived trek above the 200-day line was also halted when the late-June high near $80 was re-met.
There’s more bullishness packed into this chart than readily meets the eye, however. Another good nudge or two could do the trick.
Click to Enlarge
- Although the June effort to clear the 200-day moving average line failed, notice the subsequent pullback was halted and reversed cleanly at the purple 50-day moving average line.
- Yesterday, the gray 100-day moving average line also became a support level.
- While the 200-day line is a critical hurdle here, the $80 area has been defined as the make-or-break area for meaningful upside.
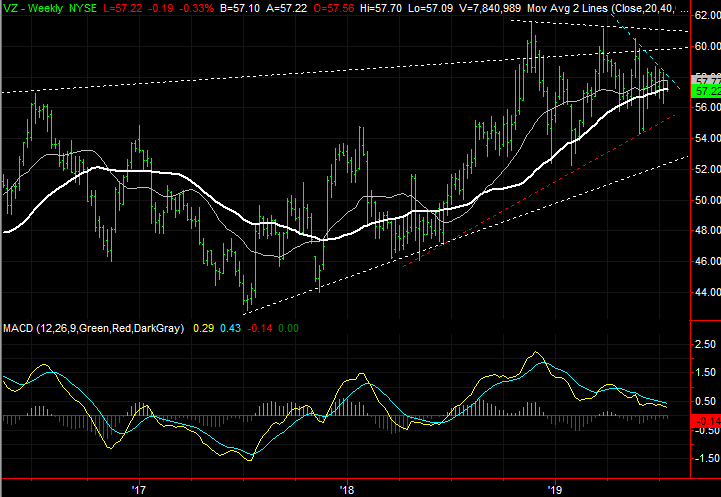
Verizon Communications (VZ)
With nothing more than a passing glance at Verizon Communications, it looks like the stock is simply range-bound, bouncing to and from near-term peaks and troughs. And, that may be all that’s taking shape here.
But, as was noted on June 21, VZ stock is increasingly putting pressure on its 200-day moving average line as a technical floor. Although it’s still intact, the stock is quietly inching closer to a break under that support, which could easily open the doors to lower lows in a hurry.
Click to Enlarge
- Just since April, the testing of the 200-day line, plotted in white on both stock charts, has heated up to where it’s being touched on a regular basis.
- Although it has not happened yet, we’re even closer to a so-called death cross now than we were a month ago. That’s where the purple 50-day average crossed under the 200-day line.
- Even a break under the 200-day line is no guarantee of a complete meltdown, however. There’s a support line at $55.34, where the red, dashed line that connects the key lows since early last year lies.
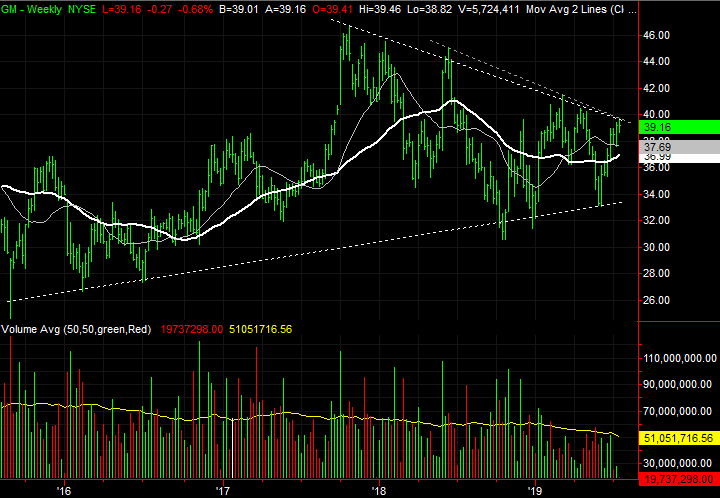
General Motors (GM)
Like all other players in the automobile industry, General Motors has struggled since “peak auto” came and went in 2015. Although it fared better than the rest and it was able to drive GM stock sharply higher in 2017, it wasn’t meant to last. The pullback has been particularly bumpy.
There has been a method to the madness behind all the volatility, however. The highs and lows going back to 2015 have formed a wedge pattern that’s squeezing General Motors shares into a point. The stock may not get all the way to the convergence of that triangle shape, however, if they can just get over the ceiling they’re testing right now.
Click to Enlarge
- There are actually two upper boundaries of the wedge. The bigger-picture one is plotted as a white dashed line, while the gray dashed line has only taken shape since early 2018.
- We’ve seen it before to no avail, but the white 200-day moving average line is sloped upward again, suggesting the longer-term trend is net-bullish.
- Although pressing the upper boundary of the wedge right now, General Motors stock might be better served by sliding a little lower, regrouping and then trying one more time.
As of this writing, James Brumley held no position in any of the aforementioned securities. You can learn more about James at his site, jamesbrumley.com, or follow him on Twitter, at @jbrumley.