Stocks logged an early win to the trading week, buoyed higher by promise for an amicable end to the trade war. All told, the S&P 500 ended Monday with a gain of 0.77%, peeling back some from a slightly stronger open, though leaving behind a dangerous gap in the process.

The Trump/Xi handshake lifted tech stocks in particular, though none as impressively as Nvidia (NASDAQ:NVDA). Shares of the GPU maker jumped 1.2%, on high volume, as it arguably had the most to gain from eased trade tensions between China and the U.S. Advanced Micro Devices (NASDAQ:AMD) and Micron Technology (NASDAQ:MU) technically logged the bigger gains though, both being investor favorites right now.
Holding the market back was Boeing (NYSE:BA), down more than 2% after JP Morgan cut its full-year earnings estimates for the beleaguered plane maker.
None are terribly compelling trading prospects headed into Tuesday’s action though. Rather, take a look at stock charts of American Airlines Group (NASDAQ:AAL), Centene (NYSE:CNC) and Mosaic (NYSE:MOS
). All three names are putting some finishing touches on big moves.
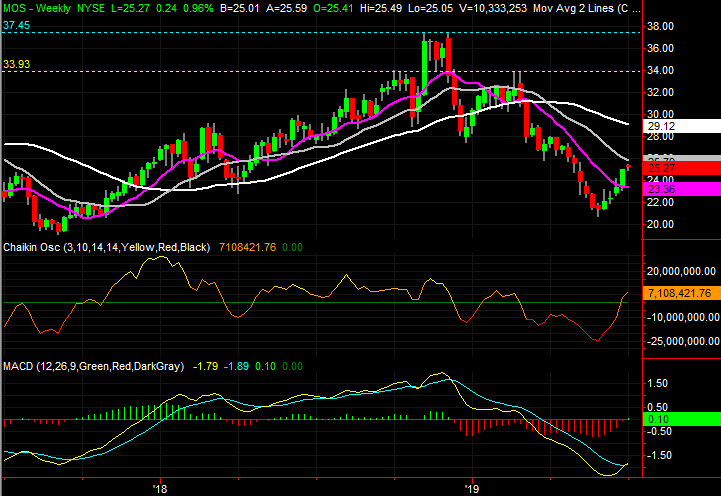
Mosaic (MOS)
The past few weeks have been decidedly bullish ones for Mosaic, unwinding at least part of the pullback it has suffered since February. Yet, it would be all too easy to chalk up the move to a dead-cat bounce, and not expect it to last much longer.
There is something remarkably different about this advance that we’ve not seen with other, failed rebound efforts from MOS though. This one has more staying power than most traders may be giving it credit for.
Click to Enlarge
- The distinguishing factor is the massive amount of volume behind the rebound effort. This much buying interest often indicates a major paradigm shift that’s built to last.
- Underscoring and bolstering the bullish argument is the bullish MACD crossover on the weekly chart.
- While it’s still only on the distant horizon, Mosaic shares have offered hints as to potential upside targets. The weekly chart shows major ceilings around $34 and then again around $34.50.
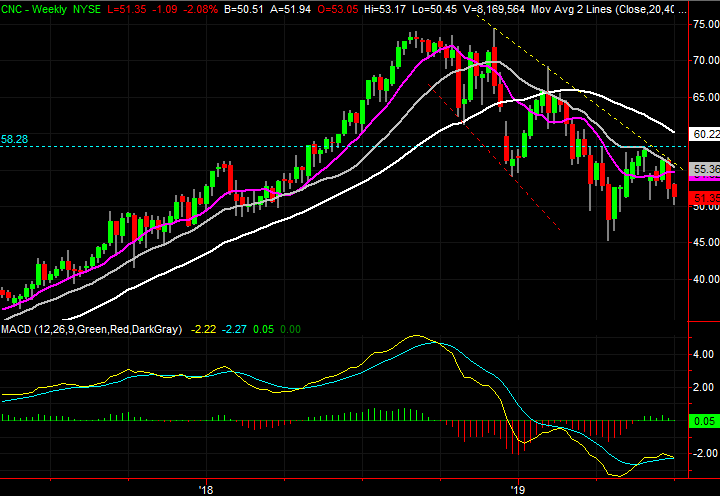
Centene (CNC)
In late May, Centene shares were featured as a potential breakout candidate. Although a very thick layer of resistance still needed to be cleared, one already had been, and the advance at the time was taking shape on impressive volume.
That breakout was never allowed to fully take shape though. Rather, when the bulls weren’t able to continue making their inspirational progress, the bears stepped back up to the plate. Since then, they’ve solidified the message that they’re the ones still in charge.
Click to Enlarge
- The ceiling that was never cleared is the $58.20 area, marked in blue on both stock charts. That’s where shares peaked in April and again in late May, when the gray 100-day moving average line moved there.
- In the meantime, the 100-day moving average line served as resistance again, when it intercepted the resistance line plotted in yellow on both stock charts that connect all the major highs since November.
- As of Monday, CNC stock has made another lower low within the confines of a falling trading range, by virtue of a move under June’s lowest price.
American Airlines Group (AAL)
Finally, back in early May, American Airlines Group shares were teasing of a breakout move. Although it was still logging lower highs at the same time a horizontal floor had taken shape, the buyers were increasing the frequency and strength of their tests of bullish waters.
AAL still isn’t above its most important technical resistance level. In fact, for a short while in late May and early June, American Airlines shares had broken under a major support level, hinting of a breakdown. That stumble may serve as a much-needed reset though, as AAL shares have broken back above one major ceiling and are back within reach of the biggest one of all.

Click to Enlarge
- The pivotal line in question has been and remains the 200-day moving average line, plotted in white on both stock charts.
- Although the 200-day line hasn’t yet been breached, or even touched in several weeks, the falling resistance line marked yellow that connected the key highs between September and February has been broken.
- That said, a new straight-line ceiling has taken shape. Marked in blue, it tags all the major peaks since February, including yesterday’s.
- While it may be somewhat evident on the daily chart, the weekly chart and its rising MACD lines better illustrate how even in the midst of what seems like net-bearishness, bullishness is brewing.
As of this writing, James Brumley did not hold a position in any of the aforementioned securities. You can learn more about James at his site, jamesbrumley.com, or follow him on Twitter, at @jbrumley.