It was a touch and go affair for the better part of yesterday’s action, but by the time the closing bell rang, it was the bulls firmly in charge. The S&P 500 didn’t make a new record high on Tuesday, but the close of 2,793.01 was 0.29% better than Monday’s last trade, and a record close for the index.

Amarin (NASDAQ:AMRN) won the day, even if it didn’t make a tremendously bullish impact on the overall market. Shares of the drug maker jumped more than 14% after the company upped its full-year revenue guidance after gauging early interest in its cardiovascular drug Vascepa. In a similar vein, Nio (NYSE:NIO) rallied nearly 8%. Although it did little to help the U.S. market, shareholders were well rewarded when other shareholders shrugged off the impact of a major recall and continued to right-price NIO shares following a brutal start to the year.
At the other end of the spectrum, Chesapeake Energy (NYSE:CHK) was off more than 5%, hit mostly by falling and oil and gas prices that also undermined other energy names.
As for trading prospects though, the stock charts of Weyerhaeuser (NYSE:WY), Pfizer (NYSE:PFE) and CVS Health (NYSE:CVS) are your top bets headed into the pre-holiday sessions. Here’s why, and what to look for next.
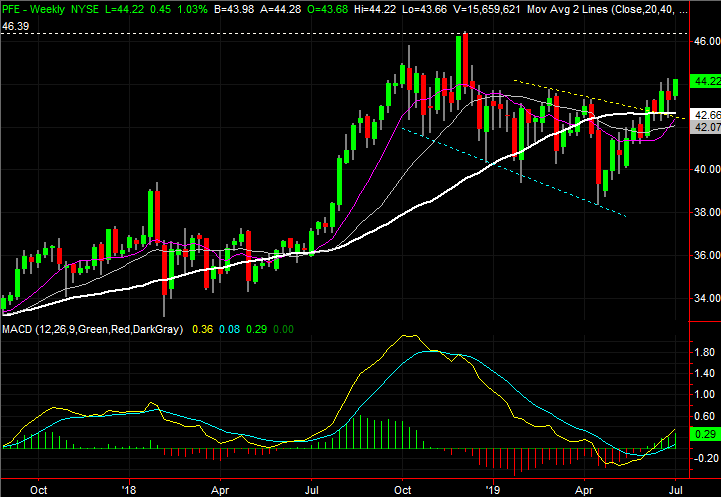
Pfizer (PFE)
Back on June 19, Pfizer was noted as a budding breakout candidate. It has just crossed above its 200-day moving average line, and although the volume behind the move was light, another effort to punch through a key resistance level around $43.30 was within reach. That move could inspire the needed volume.
That happened that very same day. Although the move ultimately wavered a bit late last month, where and how it rekindled itself made the breakout effort even more convincing.
Click to Enlarge
- While once again on modest volume, PFE has moved back above the technical ceiling at $43.30, closing at its best close in months as of Tuesday.
- The reversal point is telling. All it took was a kiss of the white 200-day moving average line on June 26 to prompt the sidelined bulls to jump in.
- Zooming out to the weekly chart we can not only see a bullish MACD divergence, but that the most plausible target here is the ceiling clearly just above $46.
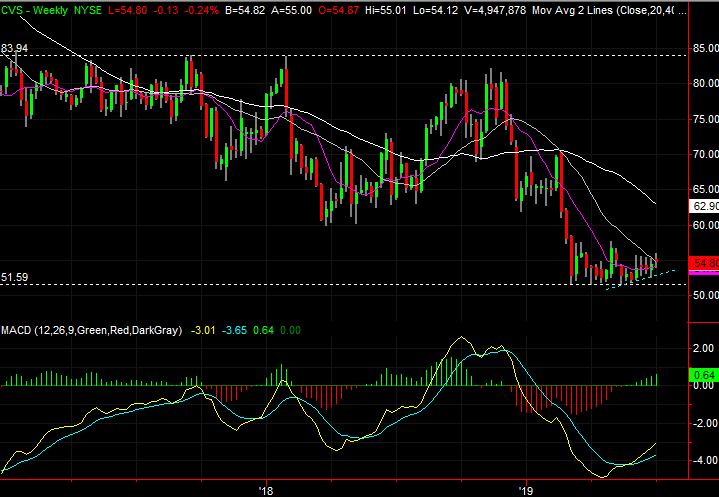
CVS Health (CVS)
CVS Health shares have been fighting a losing battle since 2017. Some of it was deserved; much of it wasn’t. But, traders have been slow to reinflate the stock’s price thus far, fearing there may be more would-be sellers waiting in the wings.
The shape of the chart since April, however, suggests we may finally be transitioning from a net-bearish to a net-bullish environment. There’s still much work to be done, but we’re starting to see support and resistance exactly where and how we’d like too it take shape as the beginning of a rebound move.
Click to Enlarge
- On Monday, CVS stock clearly bumped into the gray 100-day moving average line, peeling back as a result. On Tuesday though, the purple 50-day moving average line held up as support.
- It’s evident on the daily chart, though much clearer on the weekly chart. That is, a major horizontal floor around $52 has taken shape. That has since been followed by a rising floor, marked in blue.
- The make-or-break level from here is right around $55.55. That’s where CVS shares peaked a few times in June, and where the 100-day moving average line will be later this week when it can be tested.
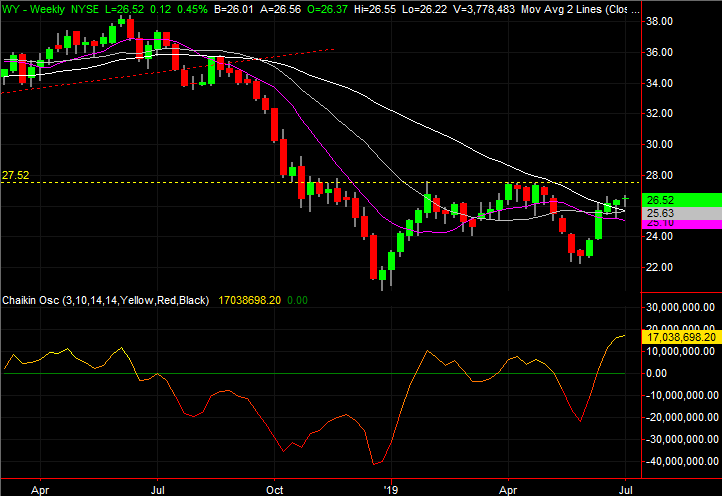
Weyerhaeuser (WY)
Finally, with the home-construction market presumably slowing down, it makes sense that shares of timber company Weyerhaeuser would be struggling. What if, however, the scope and depth of the slowdown wasn’t nearly as troubling as most investors has assumed, and priced into WY stock?
It’s entirely possible that’s what’s happened, but is now being reversed as the market realizes the stock’s undervalue. Recent gains have not only pushed shares back above one key technical hurdle, but have put Weyerhaeuser stock back within reach of another, even-bigger ceiling.
Click to Enlarge
- The recently crossed ceiling is the 200-day moving average line, plotted in white on both stock charts. It took two tries, but that resistance was cleared yesterday.
- The next hurdle is an even bigger one, near $27.50, marked in yellow on both stock charts. That line connects all the key highs going back to early this year.
- Although it would be a monumental event if cleared, once past $27.50, there’s very little left to hold WY stock back … and certainly no prior ceiling or floors until the $34 area.
As of this writing, James Brumley did not hold a position in any of the aforementioned securities. You can learn more about James at his site, jamesbrumley.com, or follow him on Twitter, at @jbrumley.