It has been a tumultuous few months for Alibaba (NYSE:BABA). Shares were undergoing a big-time breakout before a trade war escalation pounded their market value lower. BABA has since bounced back, but the charts for Alibaba stock may not be ready to cooperate.
That’s despite the company’s robust growth rate and seemingly long runway for future growth as well.
So, should investors buy on the assumption that the trade war will resolve itself? Or that growth in Asia and China will drive Alibaba’s financials higher? I believe both of those things will eventually happen. However, that doesn’t make BABA stock a buy right here, right now.
Let’s look at the charts a bit more closely to see where the BABA stock price may be heading.
Trading Alibaba Stock
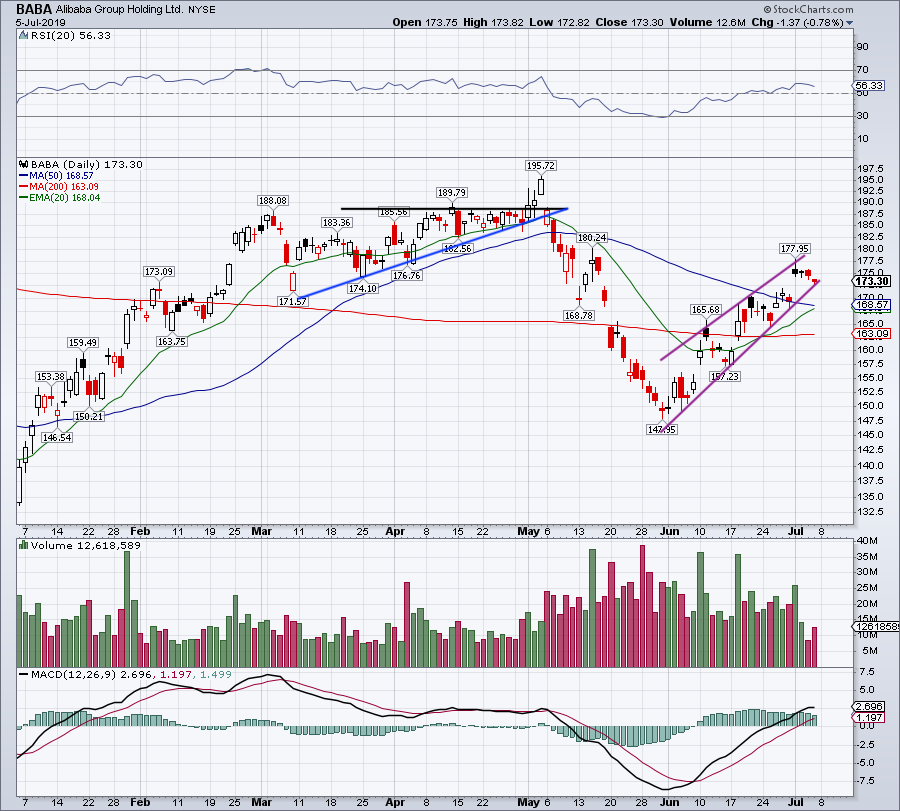
Heading into May, the S&P 500 was hovering near an all-time high. At the same time, Alibaba stock traded in the middle of a major breakout.
Click to Enlarge
In just two sessions, not only did BABA stock go from major breakout to failed breakout (that only took one session, actually) but it also lost its 20-day and 50-day moving averages.
Alibaba stock went on to shed almost 25% of its value in less than a month. Think about that for a minute. With a then $500 billion market capitalization, BABA lost one quarter of its value in just a few weeks. All thanks to a tweet from President Donald Trump that escalated the trade war. That’s an extreme reaction, but it highlights some of the risks Alibaba stock carries for investors.
So now what?
The BABA stock price has recovered some of those big May losses. It’s rallied from $148 at the end of May to $178 at the beginning of July, a 20% rally. Now though, it’s setting up in a rising wedge (purple lines), which is a bearish technical development.
If shares can continue rising and/or consolidate in a sideways manner, Alibaba stock may not resolve lower. But should it break rising support, a fall could result.
In that case, I first want to see if the $168.50 area will act as support, given that both the 20-day MA and 50-day MA are there. Below that and the 200-day MA near $163 may represent the next stop.
Valuing BABA Stock
The trade war has put a serious dampening on the sentiment for Alibaba stock. No one wants to touch Chinese equities. That said, the recent trade truce between President Trump and Chinese President Xi Jinping has helped cool tensions. Even with the trade war, though, BABA is still expected to generate strong growth.
Analysts expect revenue to surge 34.3% this year to $73.6 billion. In 2020, estimates call for 30.2% growth to $95.9 billion in sales. It’s easy to shrug off BABA stock, but I feel that many investors do not fully appreciate its growth. Back-to-back 30%-plus years of revenue growth for a $440 billion market-cap company is no joke.
As for earnings, consensus expectations call for $6.80 per share in profit this year. That’s up 21.6% year-over-year and values BABA stock at approximately 25-times current earnings. For 2020, estimates call for an acceleration to 29% growth, with earnings clocking in at $8.78 per share.
So, we have a mega-cap tech stock growing earnings 20% and revenue 30%, while trading at 25 times earnings. That’s pretty darn good.
BABA Stock Price versus Its Peers
BABA trades at roughly the same current price-earnings ratio as
Microsoft (NASDAQ:MSFT) and Facebook (NASDAQ:FB). Yet the Chinese e-commerce giant has superior growth expectations for earnings and revenue this year and next. In fact, BABA’s revenue growth is more than double that of Microsoft. Moreover, FB has forecasts for negative earnings growth this year.
Alphabet (NASDAQ:GOOGL, NASDAQ:GOOG) trades at almost the same valuation too. Yet, like Microsoft, Alphabet has about half the revenue growth rate of Alibaba, while falling well short of its earnings growth too. Amazon (NASDAQ:AMZN) has inferior revenue growth, but superior earnings growth to Alibaba. That said, it also trades at 70 times this year’s earnings estimates.
So, what’s the bottom line here? It’s not that MSFT, GOOGL, FB and AMZN are a sell. After all, you could argue that several (if not all) of these names have stronger balance sheets. But the point is, investors often dismiss Alibaba from consideration, and that’s a mistake.
Alibaba stock has strong growth and a reasonable valuation. We just need to see its price action act better.
Bret Kenwell is the manager and author of Future Blue Chips and is on Twitter @BretKenwell. As of this writing, Bret Kenwell is long AMZN and GOOGL.