The bulls tried to revive the rally from last week as the new trading week began, but no dice. The S&P 500 essentially broke even on Monday, as investors remain on the fence about the true strength of the global economy.

Twilio (NYSE:TWLO) held the broad market back more than any other name, falling more than 9% after shareholders renewed doubts about the future of the cloud-based digital customer service middleman.
At the other end of the spectrum, Bank of America (NYSE:BAC) and AT&T (NYSE:T) worked just a little bit harder. Shares of the telecom outfit ended the day up nearly 1.5% after activist investment group Elliott Management took on a stake and began clamoring for improvements. Meanwhile, BofA shares shot higher to the tune of 3%, leading an industry-wide rally spurred by a healthy rise in interest rates.
As for the stock charts that merit a closer inspection headed into Tuesday’s session though, take a look at Boston Scientific (NYSE:BSX), General Motors (NYSE:GM) and
United Airlines Holdings (NASDAQ:UAL). Here’s why.
General Motors (GM)
General Motors hasn’t been an easy name to own — or hold onto — for several years now. Aside from the sheer day-to-day volatility, GM stock has made some alarmingly big selloffs even since the 2008 recovery. Not even the auto-buying frenzy that lead to “peak auto” proved beneficial for the stock.
There has been a method to the madness the whole time though, even if it has been tough to ferret out. The trick, taking a huge step back and putting the near-term action in context.

Click to Enlarge
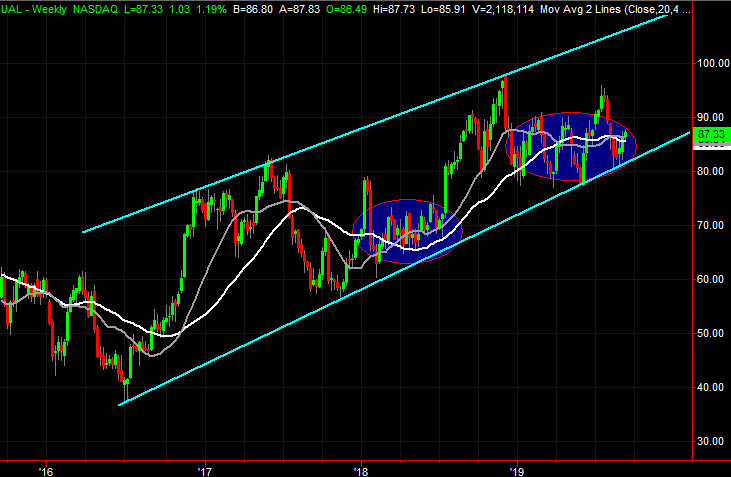
United Airlines Holdings (UAL)
With nothing more than a quick glance, United Airlines Holdings shares just look like they’re trapped in a trading range, content to drift sideways in a choppy manner. And, perhaps that’s all the past several weeks are, and will continue to be into the future.
But, given the stock’s history and the context of the current action — and where the subtle turn seems to be taking shape — it would be naive to ignore a distinct possibility here. A major bullish move could be in the works.
Click to Enlarge
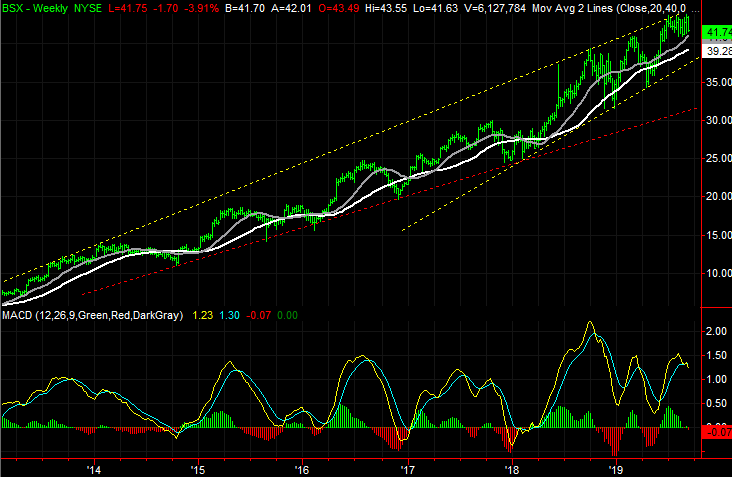
Boston Scientific (BSX)
As of Friday’s close, Boston Scientific shares looked like they were breaking out of a narrowing wedge pattern that started to take shape in June. It’s plotted in yellow on the daily chart. BSX closed above the upper boundary as of the end of last week. But, perhaps that move was the last headfake before shares finally rollover and make a move to the downside that has actually been brewing for months.
Fortunately, there are two plausible floors that will catch any pullback that gets rolling here. Unfortunately, neither is particularly close, and one is well below the stock’s current value.
Click to Enlarge
As of this writing, James Brumley did not hold a position in any of the aforementioned securities. You can learn more about him at his website jamesbrumley.com, or follow him on Twitter, at @jbrumley.