Both the S&P 500 and the NASDAQ Composite closed at all-time highs on Friday. The Dow Jones Industrial Average is just a few points away. Earnings season clearly impressed investors, moving broad indices out of a range that had held for months.

But not every sector has joined in the gains. Value stocks are starting to catch up, but growth names still lead the market. High-quality names like Procter & Gamble (NYSE:PG) and Home Depot (NYSE:HD) are at record valuations, but the likes of McDonald’s (NYSE:MCD) and Walmart (NYSE:WMT) have seen modest pullbacks.
And so even in a market at the highs, there are opportunities out there. Monday’s big stock charts highlight three of those opportunities. All three stocks have potentially bullish technical setups. In all three instances, there’s a strong fundamental case for upside as well.
Visa (V)
For years now, it’s been tough to call out Visa (NYSE:V) as one of the market’s big stock charts. Indeed, there’s been little need to look at the V stock chart.
Visa stock has been one of the market’s best: it has risen more than 300% since the beginning of 2013. Not only has V stock gained, it has moved consistently up and to the right.
Like the market as a whole, the stock sold off in last year’s fourth quarter. But that aside, an investor has to go all the way back to 2014 to find a period during which Visa stock traded even sideways for a prolonged stretch.
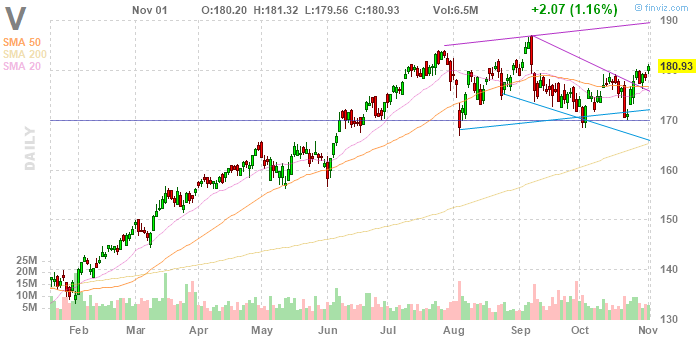
V stock has been rangebound for almost four months now, but a recent rally seems likely to continue:
- Support at $170 has held repeatedly, creating a usually-bullish multiple bottom. And the sharp rally since the most recent test of support looks bullish going forward.
- V stock has busted out of a brief downtrend. In addition, it has moved nicely through moving averages. This seems like an obvious breakout, with the potential to get at least to September (and all-time) highs of $187.
- Fundamentally, the consolidation of late has brought valuation in. V stock isn’t necessarily cheap, but at 25x forward earnings per share it’s hardly expensive. This is a market where the likes of PG and WMT are receiving 24x forward multiples — with significantly lower growth rates next year and potentially lighter long-term opportunities as well. V stock may not match the 25% annualized return it’s posted for the last decade, but it does seem like it should get back to rising ways.
Occidental Petroleum (OXY)
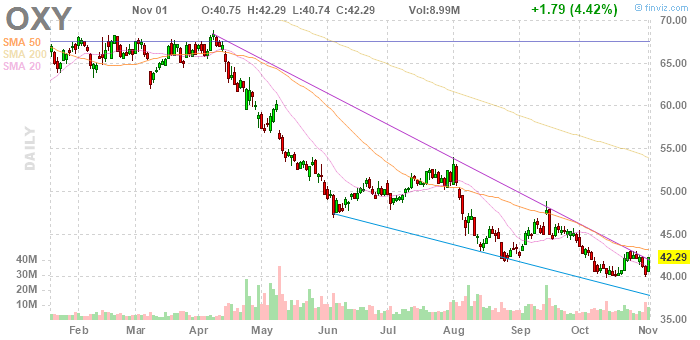
On its face, Occidental Petroleum (NYSE:OXY) looks like a dangerous stock at the moment. There’s a clear “falling knife” sense to the second of our big stock charts. OXY has fallen almost 40% since April.
Looking closer — both fundamentally and technically — there’s an intriguing, if contrarian, case for OXY stock at the moment:
- Technically, the picture is getting better. Trading since June shows a descending narrowing wedge, which often portends a reversal.
- Meanwhile, OXY is starting to challenge moving averages, and support just above $40 has held this month. If Friday’s bounce can continue, there’s room for a solid move to the upside.
- Fundamentally, there’s a case here as well. 2020 earnings estimates under $2 don’t suggest value here. But Occidental has valuable acreage worldwide, and analysts at least see roughly 25% upside from current levels.
- As noted, there are challenges. Oxy won a bidding war with Chevron (NYSE:CVX) for Anadarko Petroleum — but investors are worried about the debt and equity raised to fund that deal. Shale optimism peaked this spring, but has faded. Entering OXY here does require some fortitude; still, there’s an attractive case as OXY stock bounces off a 13-year low.
DuPont (DD)
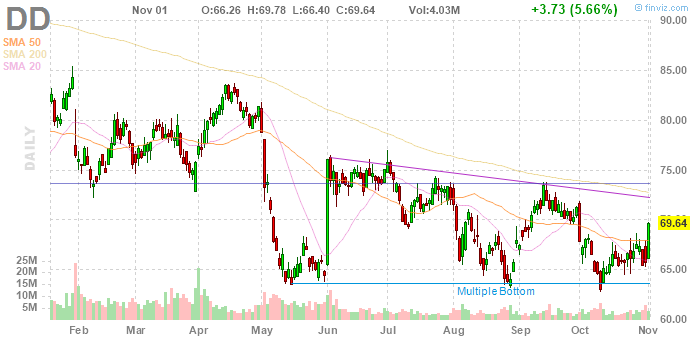
DuPont du Nemours (NYSE:DD), too, has been a disappointing investment of late. Even with a 5.7% rally on Friday after the company’s third-quarter earnings report, DD stock is down 19% from its 52-week high. The stock has gone almost straight down since the merger of DuPont and Dow Chemical, and the subsequent split into the new DuPont, Dow Inc. (NYSE:DOW) and Corteva (NYSE:CTVA).
But the third of our big stock charts highlights a potential opportunity:
- Support clearly and repeatedly has held at $64. And the post-earnings bounce pushed DD stock nicely through moving averages. There is some concern about a recent pattern of lower highs, as DD is showing a bit of a descending triangle, but Friday’s gains set up a move to at least $73 and potentially beyond.
- Fundamentally, there’s an intriguing case as well. As Barron’s wrote on Friday, analysts are coming around to the story. Earnings-based valuations don’t look necessarily attractive — DD stock trades at 16x 2020 consensus — but a cyclical rebound in the industry should help growth going forward. Sentiment here easily can reverse, which would drive the stock higher.
- And it’s not hard to see DD stock as a beneficiary of this market. With safer quality names at historically high earnings multiples, investors may be looking to take on more risk. If and when they do, the bounce in DD stock will continue.
As of this writing, Vince Martin has no positions in any securities mentioned.