U.S. stocks again look wobbly. A 1% sell-off in the S&P 500 and 1.8% decline in the Nasdaq Composite on Friday both represented the biggest declines since January. The market had shrugged off fears of the coronavirus, but as hopes of containment fade, investor sentiment may well be doing the same.

To be sure, this bull market has been prematurely written off before. U.S. stocks plunged in January when the new virus from China first begin to spread, only to rebound quickly. In 2019, trade war fears sent major indices tumbling in late July; they were back at all-time highs by October.
Still, at the least, risks are rising. With Chinese economic activity likely collapsing amid quarantines and business closures, a global recession seems increasingly possible. Even if that risk doesn’t bring down the entire U.S. market, it may well pressure more cyclical sectors.
Monday’s big stock charts focus on names in three of those sectors. All three stocks are looking for near-term support. That support isn’t likely to arrive if broad markets keep falling this week.
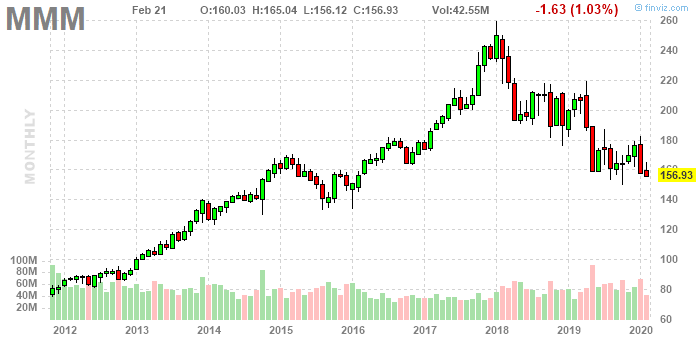
3M (MMM)
Investors gave 3M (NYSE:MMM) another chance. The first of Monday’s big stock charts shows they will have to do so again.
• Once again, 3M is back at support that mostly has held going back to last summer. But this time around, that support looks shakier. A “golden cross” in January, when the 50-day moving average crossed above the 200-day, obviously hasn’t played out. That pattern likely will reverse to a “death cross” in the next couple of weeks barring a big rally. A bounce from post-earnings low has faded, and on reasonably heavy volume.
• Fundamentally, there is a case for buying the dip. 3M’s dividend yield nears 4%, which may have attracted income investors amid past sell-offs. Shares trade at 16.5x the midpoint of 2020 earnings per share guidance — a reasonable, if not spectacularly cheap, multiple.
• But that case doesn’t hold if macro risks are rising. And one big problem for 3M stock is that coronavirus-driven weakness will only exacerbate existing trouble spots in China and the automotive and electronics markets. Revenue in China and Hong Kong declined 4% in constant currency during 2019. Even before the new virus spread, automotive sales already were soft in China and beyond, as witnessed by recent results from Ford (NYSE:F) and General Motors (NYSE:GM).
Click to Enlarge
• In other words, 3M stock faces short-term and long-term worries. So does the 3M chart. Shares have been falling since the beginning of 2018. First quarter earnings last year led to the stock’s biggest one-day decline in over 30 years. Investors who bought past dips eventually regretted it. Combine recent history with broad market worries and support for MMM stock may give.
Union Pacific (UNP)
Union Pacific (NYSE:UNP) finally managed to break through resistance in January and reach new all-time highs. But the second of our big stock charts shows that resistance now needs to turn to support:
• $180 obviously is a key level. It’s doubly important this week, given that UNP stock will also test the 50-day moving average. If shares drop again on Monday — perhaps in conjunction with another broad sell-off — there’s a path for the stock to instead test the 200-Day moving averaeg closer to $172.
• That said, as with the market as a whole, it might be too early to panic. The bearish exit from an ascending narrowing wedge is a negative, but shares have drifted south rather than making a steep reversal. Meanwhile, the uptrend since late October has seen multiple bullish tests of the 50-day moving average; recent trading could provide another such test, suggesting a bounce back toward year-to-date (and all-time) highs.
• And so the test for UNP stock this week might depend on the same test for the market as a whole. If investors are dumping stocks, UNP is unlikely to be immune. If, however, the declines are another head fake, Union Pacific stock bounces again off the 50-day — and keeps moving higher.
Transocean (RIG)
The third of Monday’s big stock charts, that of offshore drillrig lessor Transocean (NYSE:RIG), looks familiar:
• For the fourth time in a little over six months, RIG stock is testing support. There has been a repeated pattern of investors seeing the stock as too cheap — Transocean stock trades at a little over 0.2x book value — and then taking profits as oil prices and drilling activity continue to fade. Brent crude spot prices touched a 52-week low earlier this month; in that context, it’s not terribly surprising that RIG has faded.
That trading isn’t unique to Transocean stock or even to its sector. Friday’s big stock charts highlighted midstream natural gas plays EQM Midstream Partners (NYSE:EQM) and Antero Midstream (NYSE:AM), whose recent charts look quite similar. The push/pull between near-term worries and long-term optimism is being seen across energy names.
• The worry for RIG, however, is that crude is more macro-sensitive than natural gas (whose prices might actually benefit from lower shale activity). A “death cross” looms here as well. If equities and the broader economy are going to face serious near-term pressure, support for Transocean stock may not hold this time.
Vince Martin has covered the financial industry for close to a decade for InvestorPlace.com and other outlets. As of this writing, he has no positions in any securities mentioned.