Sometimes, earnings announcements provide clarity or direction for a stock’s next step. Other times, they throw a monkey wrench into what was already a messy situation. Unfortunately for Roku (NASDAQ:ROKU) stock lovers, last week’s report delivered the latter. So today, we’ll survey the aftermath and map out what to watch for moving forward.

It would have been nice for Roku to follow in the footsteps of someone like Amazon (NASDAQ:AMZN) or Nvidia (NASDAQ:
NVDA). Bulls came away from their quarterly reports as the clear winners, and their uptrends were strengthened and amplified by the powerful rally post-earnings.
Meanwhile, Roku experienced nothing of the sort — and I’m not even sure if anyone came out a victor during Friday’s whiplash. Buyers and sellers were likely both equally frustrated.
That said, let’s take a fresh look at the price charts to identify the trends and price levels that matter moving forward.
Roku Stock Charts
Click to Enlarge
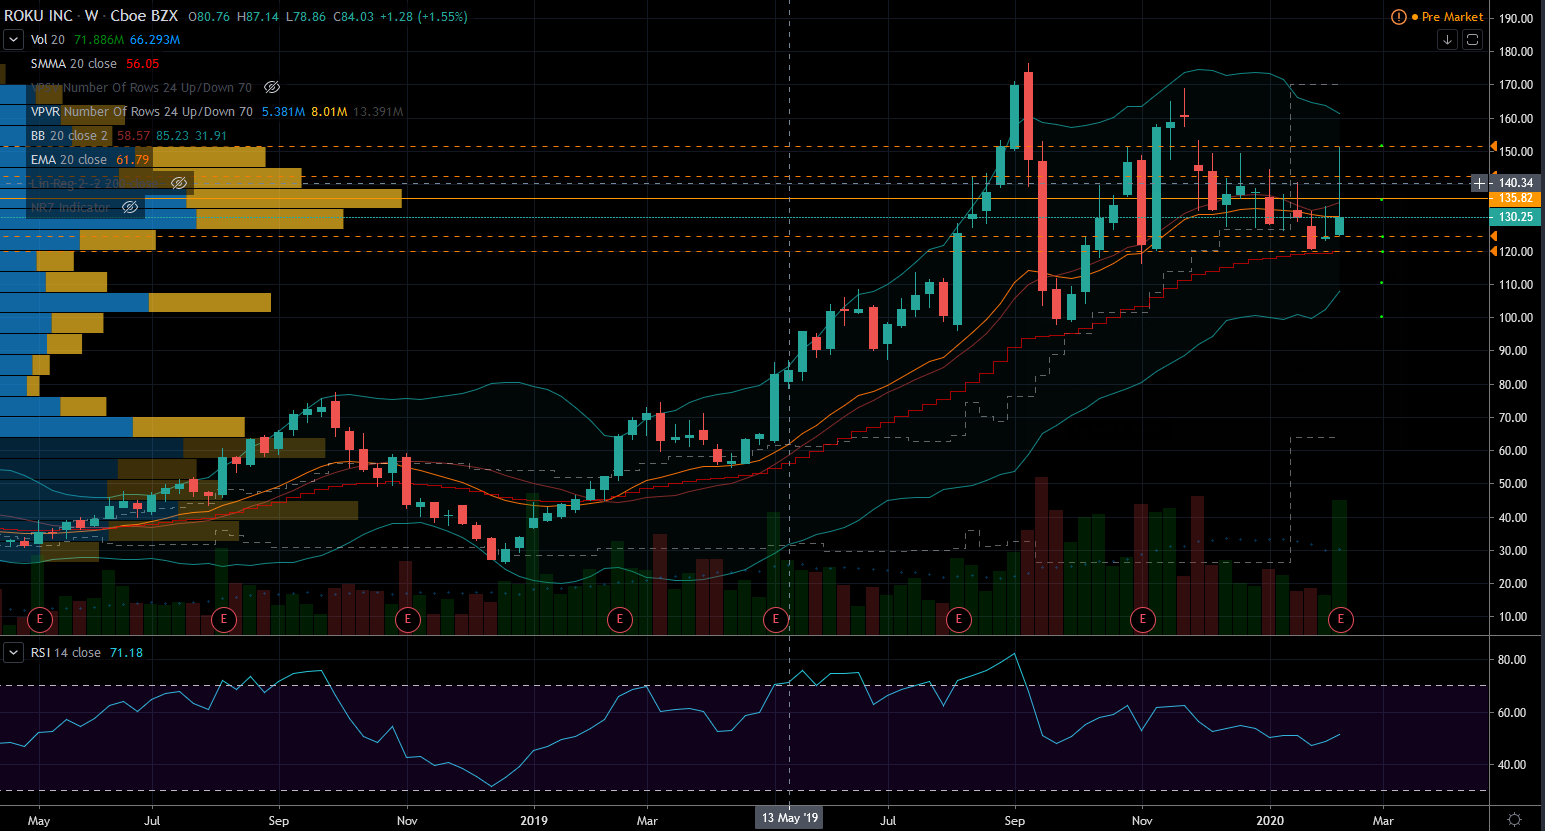
Roku’s weekly time frame was forming a symmetrical pattern ahead of the report. The series of higher swing lows and lower swing highs reveal a compression in volatility.
It’s a pausing pattern that suggests bulls and bears are at a stalemate. Earnings could have been the catalyst that finally pushed one party over the edge, but it didn’t. Instead, last week’s candle ended with a nasty long upper shadow that failed to hold the breakout attempt.
We now find ourselves back in the middle of the triangle, waiting for resolution. Setups like these are challenging to build trades around. As we drill down to the daily, however, I can spot a few price levels worth keeping an eye on. More on that in a minute, though.
There’s nothing more frustrating to a trend trader than crisscrossing moving averages. It reeks of indecision and trendless behavior. Incidentally, that’s exactly what we see in Roku stock right now. In times like this, I suggest waiting for resolution before betting. Based on the longer-term uptrend, I would expect the eventual breakout to be a move higher, not lower. But, Friday’s monster red candle makes it hard to have conviction at this point.
The high of the recent range is just over $150, while the low is closer to $120. That said, consider waiting for a breach of either zone before deploying directional trades. Until then, though, Roku belongs in the too hard bucket.
With so many other better-trending stocks out there, you have countless better choices right now.
As of this writing, Tyler Craig didn’t hold positions in any of the aforementioned securities. For a free trial to the best trading community on the planet and Tyler’s current home, click here!