The energy space has been an area of serious pain for investors this year, which didn’t do Halliburton (NYSE:HAL) any favors. First, the novel coronavirus triggered an epic stock market decline, hitting virtually every stock with massive losses. However, it also triggered a massive decline in oil prices, which weighed heavily on HAL stock too.

For the broader market, the S&P 500 fell about 35% from peak to trough. The energy sector came into 2020 already under pressure and was not hitting new highs like the overall market. Ultimately, the Energy Select Sector SPDR ETF (NYSEARCA:XLE) fell 63% from the 2020 highs to the March lows.
HAL stock outdid both of these groups, though. Shares fell 83% from peak to trough, highlighting just how painful of a decline it has been. Despite that painful slide, Halliburton stock continues to work its way higher. Can it keep going?
Trading HAL Stock
Click to Enlarge
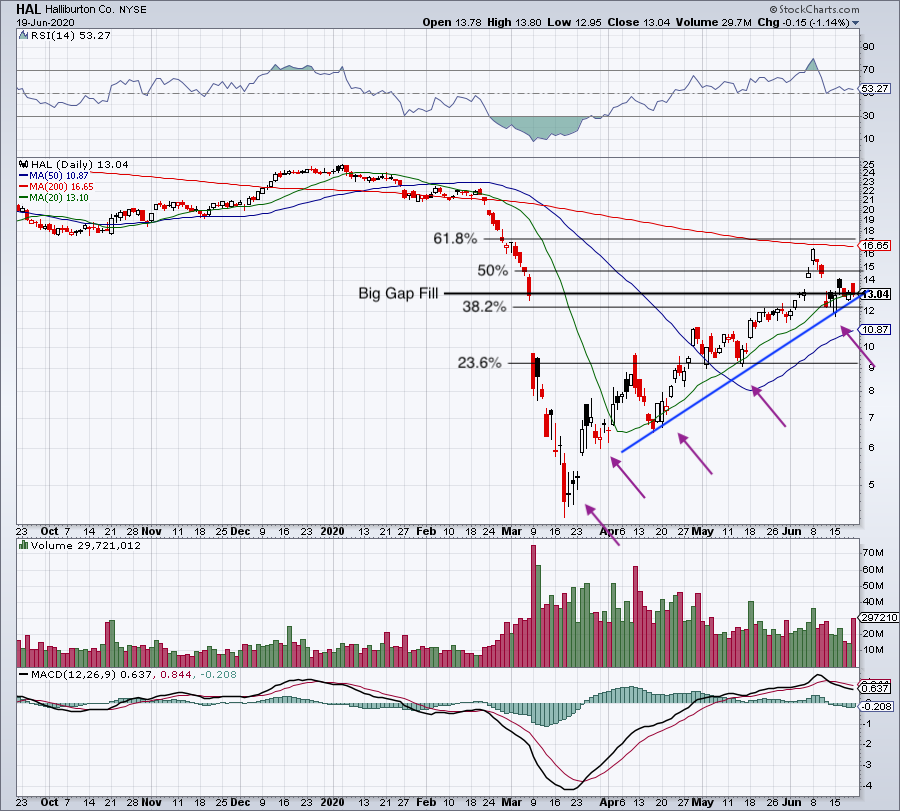
Halliburton entered 2020 trading near $25 per share. The stock finally bottomed at $4.25, as shares actually hammered out a pretty nice bottom near $5. Since then, HAL stock has continued to truck higher.
Shares keep on putting in a series of higher lows (highlighted by purple arrows), and have reclaimed the 20-day and 50-day moving averages. Halliburton suffered a massive gap-down in March, closing at $13.02 and opening at $9.70 a day layer. Earlier this month, the stock finally filled that gap before moving on to test the 200-day moving average.
Since then, shares have cooled off a bit. However, the stock still is holding up well.
HAL stock continues to hold above the 20-day moving average and uptrend support (blue line). It’s also holding up over the 38.2% retracement, which is acting as support in June after serving as resistance in May.
So what needs to happen from here?
On the downside, I would really like to see current support continue to hold. However, we must be cognizant that after such a potent rally in the S&P 500 and in oil prices, these markets may be due for a pullback. If current support gives way for Halliburton, I want to see how a dip to the 50-day moving average holds up.
Below the 50-day puts the 23.6% retracement in play. This was significant support in May on two occasions.
On the upside, let’s see if HAL stock can push through the 50% retracement near $14.75. If it can, it puts the 200-day moving average on the table, followed by the 61.8% retracement at $17.20.
Breaking Down Halliburton Stock
When it comes to the energy sector, oil prices drive the top and bottom lines. When oil prices rise, so do profits. When the commodity dives though, Halliburton, Exxon Mobil (NYSE:XOM), Chevron (NYSE:CVX), Schlumberger (NYSE:SLB), and everyone in between struggles.
The oil market is tricky. Because the Covid-19 breakout caused economies around the world to shut down, the sector quickly found a glut of supply. Producers were already sitting on oil fields ready to pump at even a whiff of higher oil prices. In other words, even in pre-coronavirus times, we had plenty of supply.
But when Covid-19 broke out, demand fell through the floor. No one needed to buy oil because they weren’t going anywhere. Cars weren’t driving, boats weren’t cruising, and planes weren’t flying. With the coronavirus numbers again spiking, it’s unclear how long it will take for the world to return to “full normalcy.”
I’m not sure what is to come, but it will be a prolonged period before companies like Halliburton return to pre-coronavirus levels of operation.
Case in point: Consensus expectations call for a loss of 10 cents per share this year and a loss of 32 cents per share next year. That’s after profit of $1.24 per share in 2019. Revenue estimates call for a 34% slide this year, followed by a 12.2% decline in 2021.
Despite the lacking fundamentals, the technicals are painting a different picture. Bulls should stay with the trend until key levels give way. Bears should avoid shorting until HAL stock is near resistance or breaking below support.
Bret Kenwell is the manager and author of Future Blue Chips and is on Twitter @BretKenwell. As of this writing, Bret Kenwell did not hold a position in any of the aforementioned securities.