July 23 was not an easy session in the stock market, as the S&P 500 fell more than 1.2%. However, on the other end of the spectrum, American Airlines (NASDAQ:AAL) rallied almost 4% on better-than-expected earnings.

So, is it time to buy AAL stock?
When we take a look at the charts, the answer isn’t overwhelmingly bullish. Instead, it shows that longs are still struggling to gain traction — even after the quarterly results topped estimates.
Therefore, let’s break down AAL stock after the report and see why it has become a favorite for those trading in the space.
American Airlines’ Earnings
The company reported a staggering loss of $7.82 per share, which eked past estimates by 8 cents. However, after losing that much money, it’s hard to consider that a win for investors. Moreover, revenue of $1.62 billion plunged more than 84%, but beat expectations by $100 million. In all, excluding special items, American Air lost $4.7 billion in the quarter.
That said, anyone that was hoping for or expecting a V-shaped recovery in the airline industry can kiss that hope goodbye.
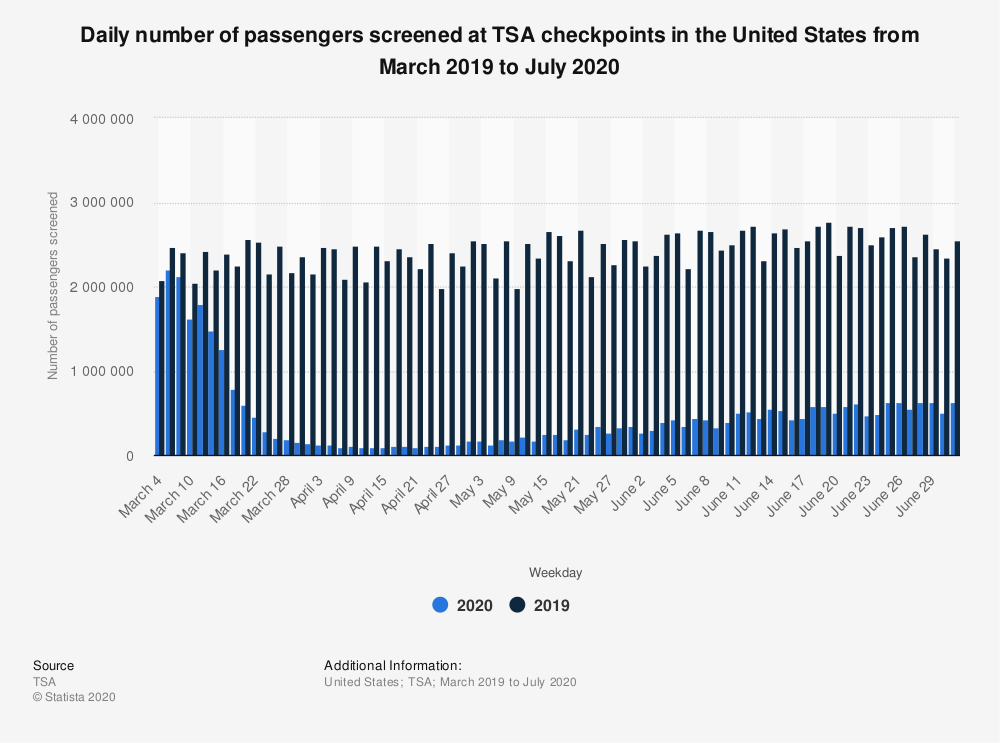
Click to Enlarge
Delta Air Lines (NYSE:DAL) CEO Ed Bastian said it would take a couple of years to see a real recovery in the space. And while airline traffic is coming back, it’s still down considerably year-over-year, as the chart here shows.
However, for how bad of a quarter it was — to no real fault of American’s — the company did pretty well.
Overall, AAL stock ended the quarter with more than $10 billion in liquidity. The airline also cut down its cash burn, burning about $55 million per day for the quarter. In April, that figure was as high as $100 million a day. By June, the company had it down to $30 million a day.
Now, the spiking number of novel coronavirus cases is causing another dip in travel demand. From the company’s press release (bold emphasis added):
“Passenger demand and load factors have improved since bottoming out in April, but continue to be significantly below 2019 levels. While May and June revenue trends were encouraging, demand has weakened somewhat during
July as COVID-19 cases have increased and new travel restrictions have been put into place.”
Trading AAL Stock
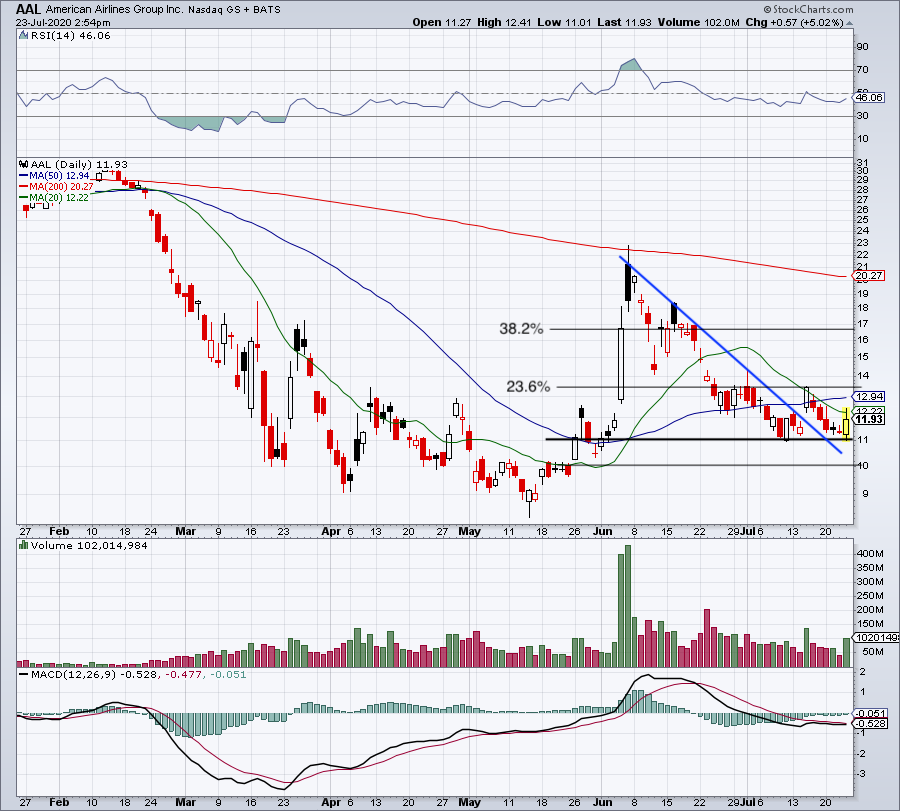
Click to Enlarge
In May, Southwest Airlines (NYSE:LUV), United Airlines (NASDAQ:UAL), AAL stock and others were breaking down to new post-coronavirus lows. However, those lows were quickly reversed, as these stocks spiked dramatically over the course of a few weeks.
American Air led the rally, as shares surged more than 120% from the low on May 14 to the high on June 5. The rally was spurred, at least in part, on news from American Airlines that flight capacities were climbing in a significant manner.
So while it was a fun few weeks for the bulls, the buying stopped there. AAL stock slammed into the 200-day moving average, and was fiercely rejected. Shares are now down more than 42% from the June high, as the stock clings to $11 support.
Should support give way, it puts a gap-fill in play down toward $10. Below that, and $9 or lower could be on the table. The longer the recovery takes, the harder it will be for American Airlines stock and its peers to gain upside traction. For that to happen, we need to see the stock clear the 20-day and 50-day moving averages. Above puts the 23.6% retracement in play near $13.50 — currently below that figure now shows just how bad the recovery has really been.
If AAL stock can clear this mark, it could open up a rally toward the 38.2% retracement near $16.90.
Bottom Line on AAL Stock
The worst may be over for AAL stock. But without a snap-back return of passengers, the business can continue to struggle.
All things considered, CEO Doug Parker is doing a pretty solid job under the current operating environment. For instance, it’s a positive to see the airline bolster its liquidity and cut down its cash burn. However, that does not mean American Airlines is a worthwhile investment right now.
The stock underperformed the broader market on the way down and has lagged on the way up for a reason. This industry is likely to be hampered for quite some, particularly as U.S. coronavirus cases continue to climb or remain elevated.
I’d like to be optimistic, but it will be awhile before the fundamentals give the all clear. Until then, we need to rely on the charts. And for now, they are not leaning bullish quite yet.
Bret Kenwell is the manager and author of Future Blue Chips and is on Twitter @BretKenwell. As of this writing, Bret did not hold a position in any of the aforementioned securities.