Amazon (NASDAQ:AMZN) has not been an impressive holding lately. After catching a nice boost in the second quarter last year due to the novel coronavirus, AMZN stock has been incredibly stagnant.

Case in point? AMZN stock is down 1.5% over the past 12 months. That’s even as the S&P 500 is up more than 30% in the same span.
The year-to-date totals are similar, with Amazon up 1.5% versus the index’s 20% gain.
Recently, Amazon gave us the pullback that I was looking for. It broke below the 200-day moving average, which looked bad to those taking a glance at the daily chart. However, that wasn’t the level to watch.
Trading AMZN Stock
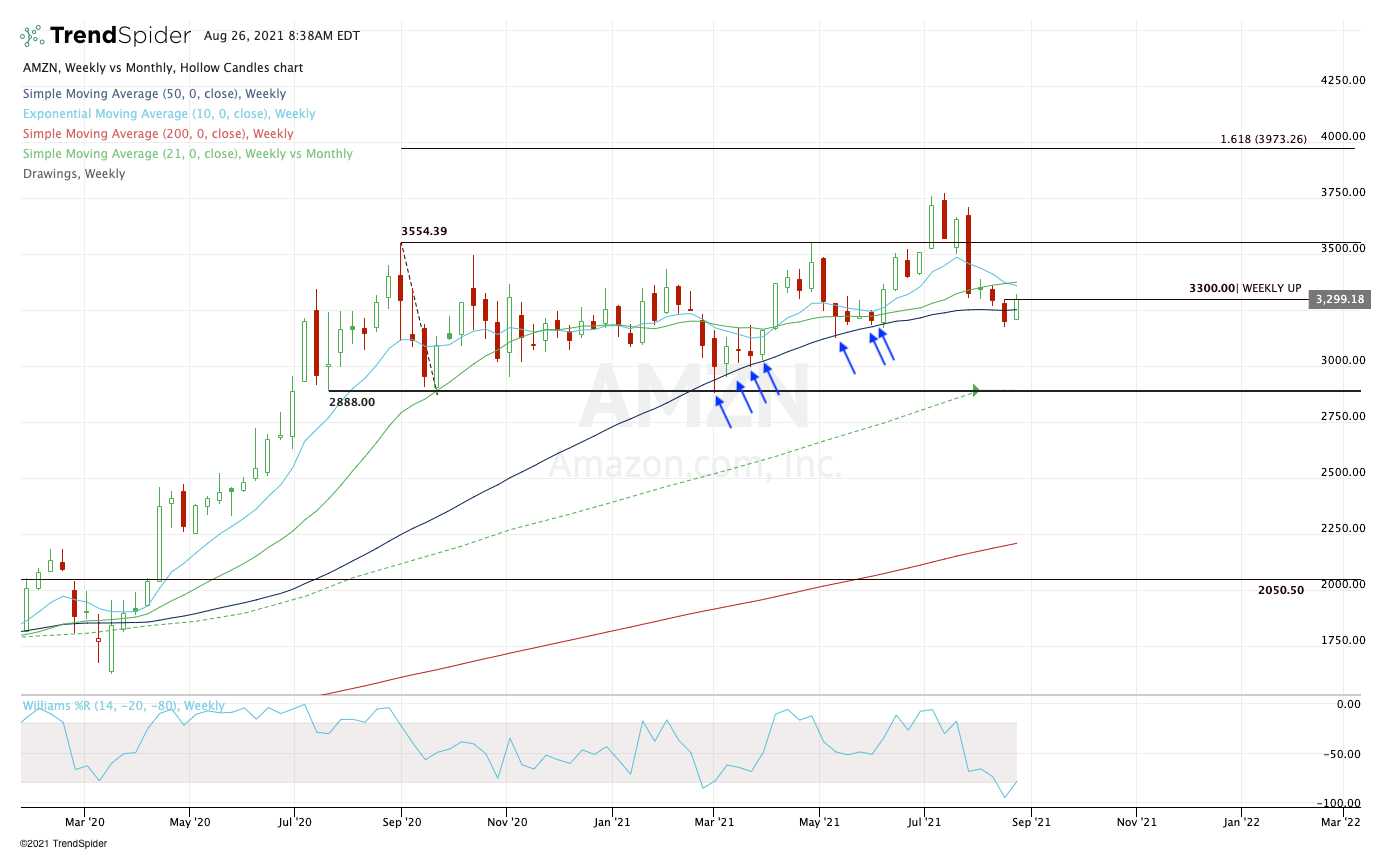
Click to Enlarge
The 200-day moving average is often followed by investors and indeed, it does play a role in a stock’s price action. However, that doesn’t mean it’s the only moving average to watch. Often, using a different time frame can make a major difference.
In this case, I am looking at a weekly chart of AMZN stock, which clearly shows the importance of the 50-week moving average.
All through March and in parts of May and June, this moving average was major support. It was reactive to this measure and in both tests, Amazon went on to make new all-time highs shortly after.
I was patiently waiting for a test of this measure and we’ve finally got it. However, there are a few notes of caution to be aware of.
First, AMZN stock closed below the 50-week moving average. While it has reclaimed this mark (and is actually trying for a weekly-up rotation over $3,300), closing below this measure was not ideal. Second, notice the trend of the 50-week moving average.
In March and May, this measure was trending higher. Now the 50-week is flat. That doesn’t mean Amazon can’t or won’t bounce – this week’s action shows just that. But it’s something to be aware of.
So how do we trade it?
With last week’s close below the 50-week moving average, we have a new risk point to monitor: Last week’s low. A daily close below that mark puts us in a risk-off position, as it opens up more downside. Specifically, it could put the $2,900 level and the 21-month moving average on the table.
On the upside, let’s see if AMZN stock can clear $3,300. Above puts the 10-week and 21-week moving averages in play. Above that and $3,500 is on the table.
A Laggard Among Leaders
There’s no denying the impact that FAANG has on the market and on investors. For what it’s worth, I include Microsoft
(NASDAQ:MSFT) in that discussion too. With those six stocks, we’re talking about some of the most popular names in the stock market. So, they matter when it comes to sentiment.
They also matter when it comes to size.
FAANG+M weighs in at a combined $9.6 trillion in market capitalization. That number is hard to fathom — it’s an unbelievable amount of wealth that’s been created over the years.
All the components with the exception of Netflix (NASDAQ:NFLX) have a market cap north of $1 trillion. Three weigh in with a market cap north of $1.9 trillion. However, not all have performed equally.
Amazon is the worst-performing FAANG+M stock over the past year. In fact, it’s the only stock that’s down in that timeframe, while every other component is up at least 11.2%. At a time where e-commerce is enjoying secular growth and a boost from Covid-19, the one stock many would have banked on to rally has completely stalled.
Breaking Down Amazon
That creates an interesting dynamic. Do investors stick with the winners, like Microsoft and Alphabet (NASDAQ:GOOGL, NASDAQ:GOOG) and avoid the losers? Or do they go with the “Dogs of the Dow” approach and scoop up the laggards, like AMZN stock?
Here’s the thing with Amazon: It’s not going anywhere.
That type of thinking can be dangerous when it comes to investing, but at least in the interim, it’s true. Amazon dominates e-commerce in the U.S., while its advertising and cloud businesses have created a formidable combo-punch.
The rest is just semantics — either you want to own a tech conglomerate or you don’t, it’s really that simple.
Whether it’s in favor or out of favor, I’m of the opinion that it’s just a matter of time before Amazon regains its bullish momentum. Why? Just look at the growth.
Amazon is forecast to generate 23.5% revenue growth this year and almost 20% growth next year. On the earnings front, it’s forecast to generate 27% and 25% growth in 2021 and 2022, respectively.
You can only hold back a stock for so long when it’s generating top- and bottom-line growth at or in excess of 20%.
For Amazon stock, it’s more of a “when” not “if” situation in terms of its next rally. At least in my mind. With the way investors have been gobbling up stock splits of major tech companies over the last year, it seems like Amazon is one split away from snapping out of this funk.
As we approach the ever-important fourth quarter, keep this name on your list. Either a rotation higher or a dip toward $2,900 could be rewarding.
On the date of publication, Bret Kenwell did not have (either directly or indirectly) any positions in the securities mentioned in this article. The opinions expressed in this article are those of the writer, subject to the InvestorPlace.com Publishing Guidelines.
Bret Kenwell is the manager and author of Future Blue Chips and is on Twitter @BretKenwell.