Wednesday’s action is why you never turn your back on the market. Tuesday’s gain not only snaped a three-day losing streak, it hinted that the bigger-picture rally may be rekindled.
With its loss of 0.76% yesterday, the S&P 500 is back in a bearish groove, feeling the weight of July’s surprisingly robust advance.
Leading the charge lower was Micron (NASDAQ:MU), off more than 6% as traders continue to worry the technology sector is running into a headwind, with a memory chip glut as the featured centerpiece.
Macy’s (NYSE:M) actually lost more ground, ending the day down nearly 16% after the retailer reported quarterly sales actually fell.
So much for the retail rebound.
There were a handful of bright spots, though. Chipotle Mexican Grill (NYSE:CMG) advanced more than 6% following a big upgrade from Morgan Stanley. There just weren’t enough winners to keep the market out of the red ink.
As Thursday’s action gets going, AT&T (NYSE:T), Hormel Foods (NYSE:HRL) and International Paper (NYSE:IP
) are shaping up as the top trading bets. Here’s why:
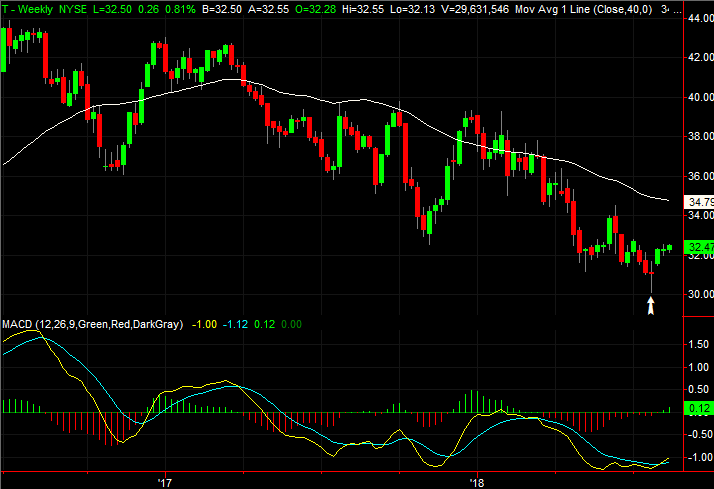
Stock Charts to Watch: AT&T (T)
Most everyone knows AT&T stock has been run through the wringer over the course of the past few months. Specifically, T stock fell 30% from its early 2017 peak to last month’s low.
What most investors can’t fully explain, though, is exactly why AT&T’s stock peeled back the way it did.
The company’s still one of the more prominent telecom players, and the Time Warner deal — though not cheap — will be largely self-funding as it makes the company more marketable. That, against a backdrop of a price-earnings ratio (P/E) of only 6.3, sets the stage for a recovery that may well be underway now.
Click to Enlarge
-
- The weekly bar from four weeks ago (marked with a white arrow on the weekly chart) is a doji bar, which are often seen at a key pivot. The uptrend that’s materialized since then largely confirms that was a ‘turn.’ It was enough to lead to a bullish MACD cross.
- On the daily chart, we can see the recent bounce has pushed T shares above the 50-day moving average line (purple), which has since found support there.
- That same daily chart also makes clear that a ceiling around $32.80 needs to be cleared for the budding uptrend to fully take hold. That will happen, but for it to happen in earnest, a few more bulls need to jump in. The rising Chaikin line is a step in that direction, but the effort needs more. [That said, should T break above $32.80, the volume will likely start to take shape.]
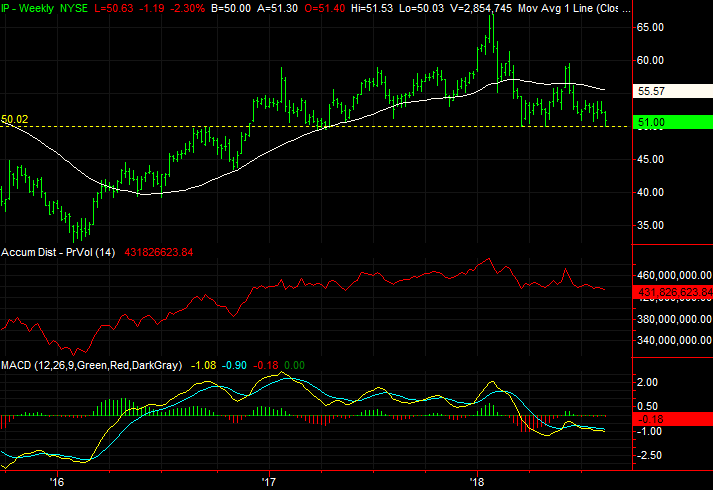
Stock Charts to Watch: International Paper (IP)
With nothing more than a passing glance, shares of International Paper look volatile, but not necessarily in dire straits.
In taking a longer, closer look at both the daily and the weekly stock charts, however, it becomes clear IP is hanging by a thread. One wrong move could push the stock past the tipping point and into an unstoppable downtrend.
Click to Enlarge
- The line in the sand is right around $50.00, marked by a dashed line on both charts. That’s been the ultimate low for weeks now, including on Wednesday. Below that level, there’s no clear support.
- It’s subtle, but telling all the same… all the moving average lines on the daily chart are pointed downward, saying the momentum is bearish in all relevant timeframes.
- The weakness hasn’t been a hollow one either. There’s been healthy volume on down days. The weekly chart’s accumulation-distribution line is also at multi-month lows and testing the waters of moving even lower.
Stock Charts to Watch: Hormel Foods (HRL)
Finally, it would be naive to suggest Hormel Foods shares aren’t edging higher largely because the entire food industry is watching its stocks do the same. On the other hand, it doesn’t matter. Indeed, trends that are group-driven tend to be more reliable.
HRL is unique, however, in that it’s in the best position for more bullishness ahead than its peer are … if it can push past one last ceiling.

Click to Enlarge
- The technical ceiling in question is right around $38.00. That’s where the stock’s peaked with each major high going back to early last year. That resistance was tested again yesterday.
- This test of the ceiling is different than previous ones have been, however. This one is being fueled by a rising support line that’s been in place since the early-December pivot.
- All the moving average lines are pointed upward, and HRL shares have been finding support at most of them en route to this test of a major technical ceiling.
As of this writing, James Brumley did not hold a position in any of the aforementioned securities. You can follow him on Twitter, at @jbrumley.