Tech peers Facebook (FB), Amazon (AMZN), Netflix (NFLX), and Alphabet (GOOG, GOOGL) are collectively known as the FANG stocks and have unquestionably provided leadership for the stock market.
As such, traders target the FANG stocks to get a sense of where the market might be headed next. While no single data point should be taken in a vacuum, Profit Scanner powered by Recognia has reviewed the technical analysis for each of the four FANG stocks and has provided a positive picture for the foursome in the intermediate term – and Netflix has a target price that puts it some 25% higher in a matter of weeks.
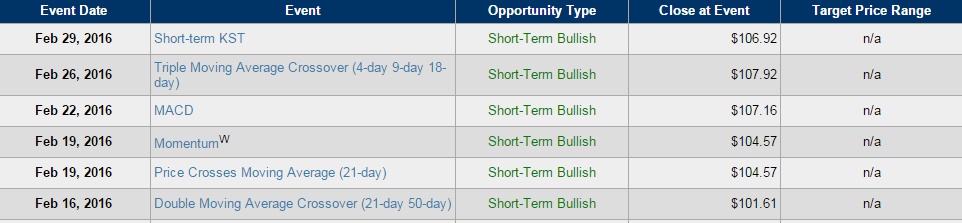
The ‘F’ in FANG Stocks: Facebook (FB)
Bullish signals piled onto FB’s chart in late February, as noted by the green dots in the chart below:

Chart courtesy of Recognia.
While none of these short-term signals correspond to a price target, the following events are noteworthy and suggest that the near-term path for FB is up:
The ‘A’ in FANG Stocks: Amazon (AMZN)
Here, too, Amazon’s chart is loaded with bullish events, represented by the green dots:
Chart courtesy of Recognia.
Here are the specific bullish signals, all pointing to bullishness for AMZN in the weeks ahead:
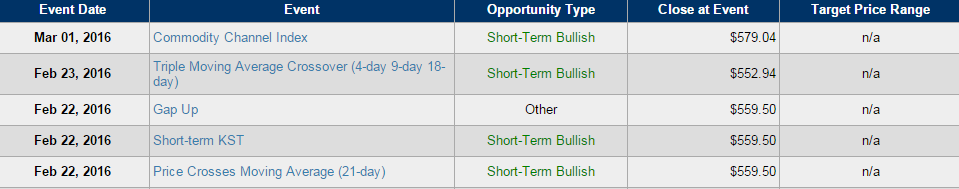
As noted above, these events do not provide a price target for AMZN, but
Profit Scanner provides that support is found at $555.23 and resistance is found at $675.89.
For traders who initiate bullish trades on AMZN, Profit Scanner offers a tight stop as a close below $539.17.
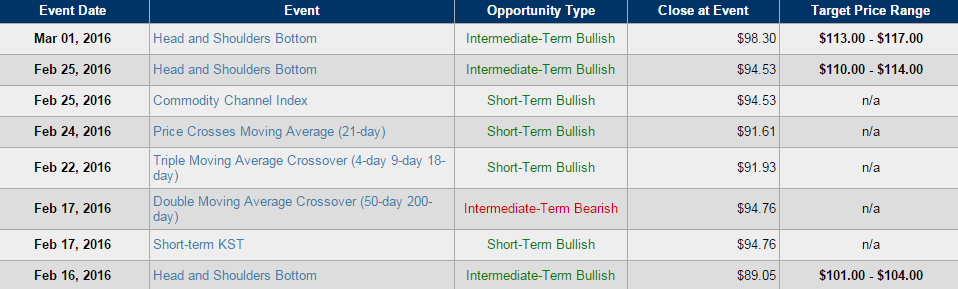
The ‘N’ in FANG Stocks: Netflix (NFLX)
On Feb. 26, an initial bullish Head and Shoulders Bottom pattern appeared on NFLX’s chart carrying a price target of $101.00 – $104.00 during the course of the next several weeks.
A Head and Shoulders Bottom tells traders that the price seems to have reached the end of an accumulation period at the bottom of a major downtrend. A break up and through resistance messages a reversal to a new uptrend.
Then, on Feb. 25, NFLX put in another Head and Shoulder Bottom with a revised intermediate target of $110.00 – $114.00.
And, again, on March 1, NFLX’s chart showed a third Head and Shoulders Bottom, seen on the chart below, with a still higher target of $113.00 – $117.00, which Profit Scanner suggests will take approximately 25 trading days to play out.
Chart courtesy of Recognia
Profit Scanner notes that support resides at $89.05 and resistance occurs at $98.99.
For those inclined to enter NFLX at current levels, Profit Scanner provides a “tight” stop at $89.99. Here is the full list of recent short-term events for NFLX:
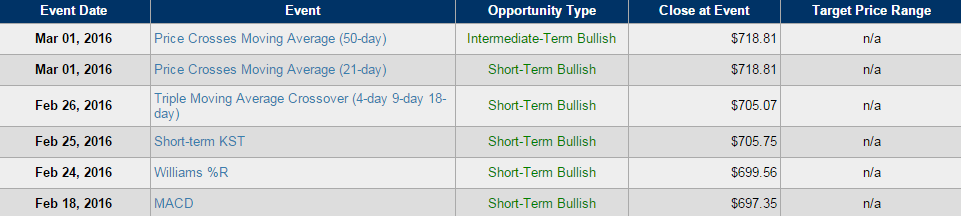
The ‘G’ in FANG Stocks: Alphabet (GOOG, GOOGL)
Scanning GOOG’s chart patterns, Profit Scanner reveals the recent signals are all about bullish moving average activity.
On March 1, the GOOG made two bullish moving average (MA) crossovers of the 21-day MA and the 50-day MA. While these events don’t correspond to a target price, they do suggest that GOOG is bullish in the short to intermediate term.
Chart courtesy of Recognia.
In simple terms, a stock’s price is generally in an established trend (bullish or bearish) for the time horizon the moving average period represents (in this case, 21 days and 50 days). Moving averages are used to smooth out the volatility or “noise” in the price series, to make it easier to discover the underlying trend.
By plotting the average price over the last several bars, the line is less “jerky” than plotting the actual prices. A bullish event is generated when the price crosses above the moving average, and in this state, the price is likely in an established uptrend. The opposite is true when the price crosses below the moving average, triggered a bearish event.
For those inclined to take bullish positions in GOOG either by buying the shares or buying call options, Profit Scanner notes that support is found at $736.26, while resistance resides at $761.38.
For any bullish trades, Profit Scanner suggests a tight stop at $694.86 as a potential signal to exit upside trades. Below, you can see all of the events on GOOG’s chart since mid-February.
Profit Scanner powered by Recognia can help traders of all levels uncover these signals to determine the best timing to buy. Or use Profit Scanner’s technical insight to validate your own trading ideas. See how easy this powerful tool is to help you uncover hidden opportunities in the market.