For lack of a better word, investors hated Amazon.com, Inc. (NASDAQ:AMZN) in 2014.
 Last year, AMZN stock fell by around 20% at the same time that the likes of the broad-based SPDR S&P 500 ETF Trust (NYSEARCA:SPY) and tech-heavy PowerShares QQQ Trust, Series 1 (ETF) (NASDAQ:QQQ) gained a much less rough-‘n’-tumble 12% and 18% thereabouts.
Enough said.
The trading and enthusiasm for Amazon stock thus far in 2015 has been an entirely different story. While the SPY struggles in volatile fashion with a flat performance for the year’s first three months and the QQQ with a slightly less aggravating 2%, shares of AMZN stock have flown higher by almost 20%.
What’s up with this high-flying turnaround in shares of AMZN?
AMZN Bullish Factors
First, a substantial earnings beat and well-received report in late January was behind the initial launch off weekly technical support. On the heels of the quarterly release AMZN stock throttled higher by nearly 14% the very next session.
Secondly — and maybe accounting for the other handful of percentage points AMZN has managed to tack on this year — optimism for the company’s cloud business
and its drone program are factors to consider. Readers will have to decide for themselves, but those areas could prove to be substantial growth drivers for Amazon, and might be partly responsible for Amazon’s continued post-earnings strength.
AMZN Technical Picture
From its early highs around $400 in January 2014, shares of AMZN came under pressure to close down about 20%. Technically, though, the negative price performance in Amazon stock resulted in the development of a rather impressive and positive, corrective triple bottom pattern.
The most recent action in 2015 has improved upon AMZN’s technical base. After the fast earnings-related launch, Amazon stock is now sitting solidly in the upper third of the prior corrective range.
Another good sign technically is the last five weeks have seen a tightening of price action which thus far has held a key pivot high within the triple bottom’s construction. In total, when looking at the past year and change, AMZN’s pattern takes on the characteristics of a “cup-like” or flawed W base with handle — price action that’s generally accepted as being bullish.
Iron Condor on Amazon Stock
While Amazon’s case appears optimistic in nature, the broader market (and its ability to move higher) is a concern. Further, without that wind at our backs and Amazon not set to release earnings until April 23, a strong catalyst to move AMZN stock out of its current trading range seems less likely.
Click to Enlarge
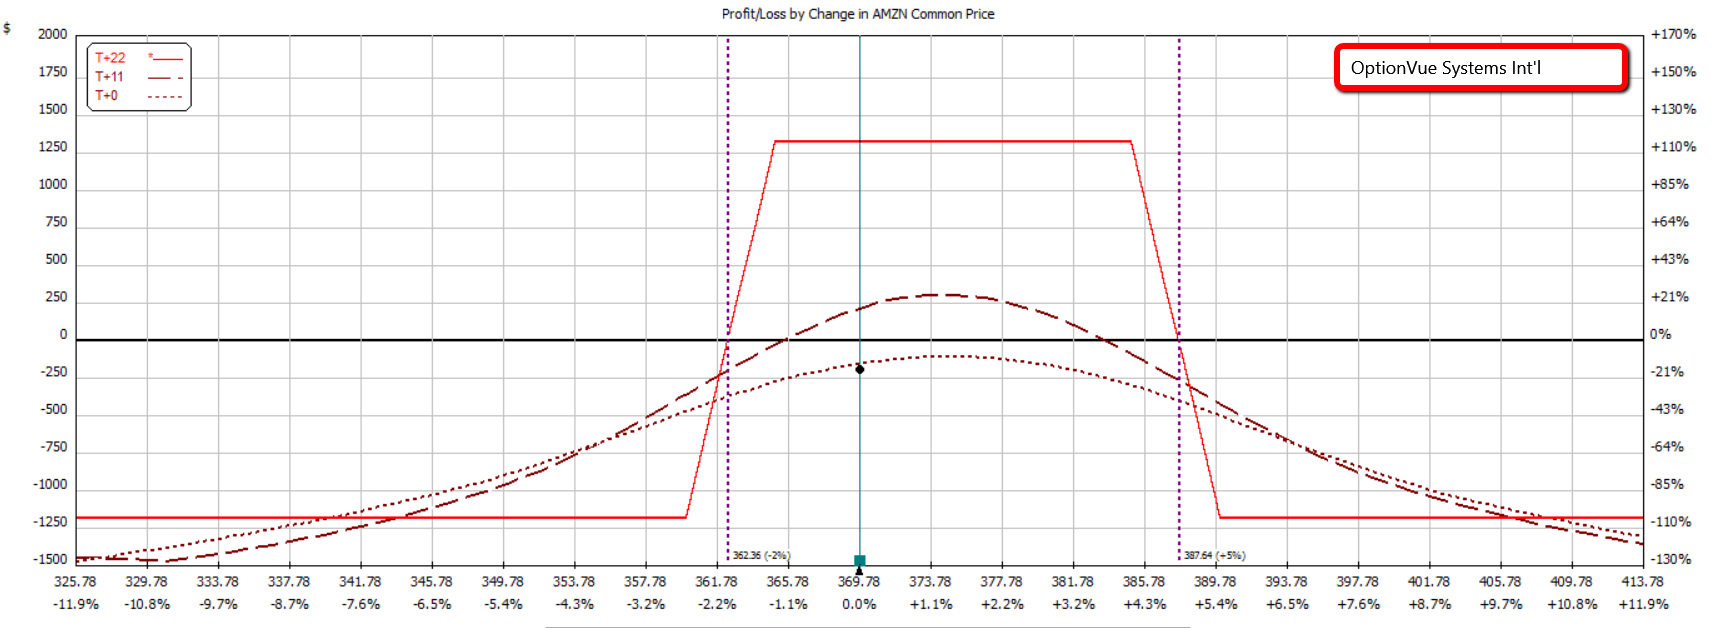
An iron condor option spread is designed by selling a vertical call spread and vertical put spread of the same expiration. Typically, both spreads are initially out of the money. The combined verticals result in a limited-risk, maximum-profit zone between the sold strikes. On the downside or “floor” as we annotated in the AMZN stock chart, the breakeven is defined by the short put minus the sum of the premium collected from both spreads. The “ceiling” on the AMZN chart or upside breakeven for the iron condor is the higher short call plus the sold premium.
An iron condor’s maximum risk is simply the difference in the strike width of one spread minus the total premium collected. Since only one of the two spreads can be in the money at any point in time, just one is needed to calculate risk. However, if you’re being creative and use different width verticals — which is made very easy in AMZN since it maintains 2.5-point strikes — make sure you use the wider vertical in extracting your position’s risk.
One potential AMZN iron condor is the Apr $365/$360 put spread and Apr $385/$390 call spread. With Amazon stock around $370, the combined spread or iron condor trades near $2.65. Much like a well-functioning drone with its requirements as to how low and how high it can operate without getting in trouble; the same can be said of the iron condor.
The profit floor at expiration for this iron condor (i.e., where it breaks even) would be $362.35 in AMZN stock. The trader’s max risk of $2.35 would be realized below the purchased $360 strike should Amazon shares gyrate even lower.
Likewise, this AMZN iron condor (which incidentally reminds me of a drone in its appearance) maintains a less cloudy but equally important ceiling of $387.65 for breaking even. There’s also a similar loss of $2.35 above $390 if Amazon stock clears that strike.
But, if there’s no real stock turbulence or strong lift and shares of AMZN zig and zag comfortably from $365 to $385, the trader can earn the entire credit of $2.65 per spread and have it delivered right into their accounts.
The information offered is based upon Christopher Tyler’s observations and strictly intended for educational purposes only; the use of which is the responsibility of the individual. Mr. Tyler currently holds no positions in Amazon.com, Inc. in his personal or managed family accounts but may initiate, for better or worse, a position in two or more business days following the publication of this article.