Though it’s not quite clear how or why, the market opened bullishly and closed bullishly on Tuesday, despite a bit of worry in between. The S&P 500 ended the day at 2820.40, up 0.48%, inching closer to its record high hit in January. It wasn’t exactly the kind of bar that makes it easy to create a bullish encore, however.
Investors can mostly thank AT&T (NYSE:T) for setting the bullish tone. The stock closed up 2% in front of its post-close earnings report, though a revenue miss cut that gain in half during after-hours trading. As for the market’s dead weight, that (dis)honor belongs to Advanced Micro Devices (NASDAQ:AMD). It fell nearly 3%, though that weakness may have had more to do with tech-sector malaise than about the company specifically.
In short, it’s an environment that requires traders keeping their head on a swivel, and remain disciplined enough stick with more proven and plausible setups. For Wednesday, those are Scana Corporation (NYSE:SCG), News Corp (NASDAQ:NWSA) and Zoetis (NYSE:ZTS). Here’s why.
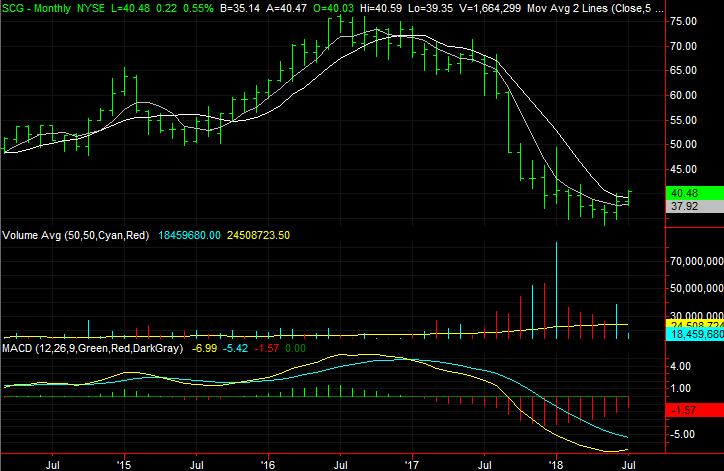
Scana Corporation (SCG)

If the name SCANA Corporation rings a bell, it may be because it was one of the three big stock charts dissected back on July 9. At the time, it was toying with a bullish breakout, by virtue of its move just above its 200-day moving average line (white). That move never happened. Rather, the then-overextended stock peeled back more than enough to put the trade on ice.
Take it out of the freezer now, however, as the stock has pushed above its 200-day moving average line again. And this time, it’s got staying power.
Click to Enlarge
• There was also plenty of volume behind Tuesday’s pop, suggesting it’s a majority opinion. In fact, the rising accumulation-distribution line says the majority opinion has been bullish since mid-May. This advance has plenty of undertow.
• The monthly chart’s volume data and shape also bode bullishly. The selling volume was deteriorating all the way down since the beginning of this year, and the turnaround was a slow, methodical U-shaped reversal. They tend to last longer, with better follow-through.
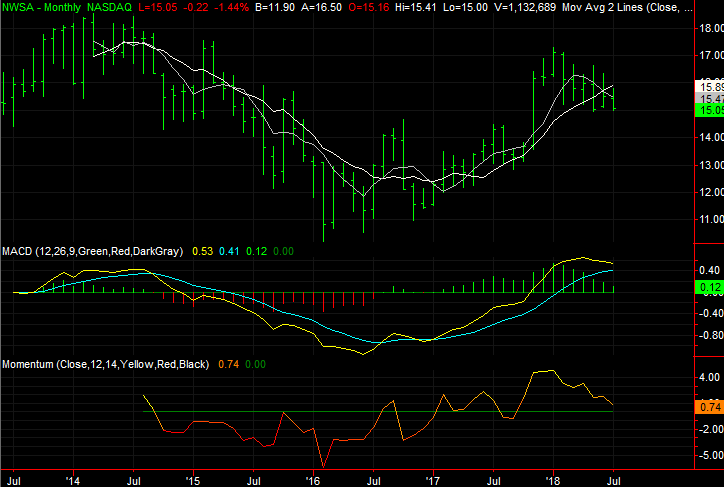
News Corp (NWSA)
News Corp shares have been trending lower since February’s peak. But, thanks to Tuesday’s weakness against a backdrop of marketwide bullishness, the odds of the stock reversing course and getting back into an uptrend have been all but obliterated.
Though the bulls may make one last-ditch effort to stave off a bigger selloff, it’s likely to fizzle pretty quickly, setting the stage for a much more pronounced pullback.
Click to Enlarge
• Just this month, the 20-day and 50-day moving average lines have fallen under the 200-day moving average line (white), and 100-day line (gray) is about to do the same. The downtrend is undeniable, and worse, the 20-day moving average line seems to be serving as a technical ceiling, guiding NWSA a little lower each time it’s tested.
• Given the pattern of at least a small bullish pushback at the lower support boundary of the trading range, odds are good we’ll see it happen again. In light of the cumulative deterioration though, that effort is apt to be the weakest bounce effort yet, and vulnerable to one final blow against the stock’s chart.
Zoetis (ZTS)
Last but not least, Zoetis may be a reliable earnings and revenue growth machine within the animal health space. But, the big rally that’s materialized since early 2016 may have been a bit too aggressive given its growth rates. The forward-looking P/E of 24, though not outlandish, is pushing boundaries.
It’s a reality that’s seemingly starting to weigh on investors’ minds, if the recent action — or inaction — from the chart of ZTS is any indication. In fact, one more down day could start a chain-reaction selloff.

Click to Enlarge
• Even before this week’s modest lull, however, the tide was taking a turn for the worst. Slowly but surely since March, the 20-day and 50-day moving average lines (blue and purple, respectively) have been converging toward the 100-day moving average, indicating a slowing of the uptrend.
• The downward-sloped accumulation-distribution line also tells us there are more sellers than buyers here, and have been for a while.
As of this writing, James Brumley did not hold a position in any of the aforementioned securities. You can follow him on Twitter, at @jbrumley.
“Financial Anomaly” to Trigger Windfall Profits
As you read this, a rare set of events has created what we believe will become one of the three biggest investment opportunities of your life, no matter when you were born.
This “financial anomaly” could a trigger a financial boom that will hand investors 10x gains … 20x gains … even some 50x gains.
This boom will take place in the legal marijuana business.
If you missed the opportunity to make 50 times your money in internet stocks … or if you missed out on the opportunity to make 50 times your money in bitcoin, you’re going to want to know exactly what’s going on here.