The market continues to do the “Indecision Boogie,” reversing course for the third time in as many days. The S&P 500 ended Thursday at 2840.89, up 0.79%, but still conspicuously below the day’s high.
Once again, when push came to shove as the closing bell approached, traders made it clear their convictions (in either direction) are muted.
Not every name was content to remain on the fence … Walmart (NYSE:WMT) surged more than 9% on the heels of a strangely impressive second-quarter report. Cisco Systems (NASDAQ:CSCO) gained 3% on a solid quarterly report, too.
There were plenty of names on the other side of the table though. Facebook (NASDAQ:FB) dropped nearly 3%, and JCPenney Company (NYSE:JCP) tanked to the tune of nearly 27% after posting alarmingly poor second quarter numbers.
Moral of the story? The market’s overall tepidness isn’t infecting every single stock. There are still lots of trading opportunities out there. Chief among them as we start the last trading day of the week are Netflix (NASDAQ:NFLX), PG&E (NYSE:PCG) and Boeing (NYSE:BA).
Here’s a closer look at stock charts of each one:
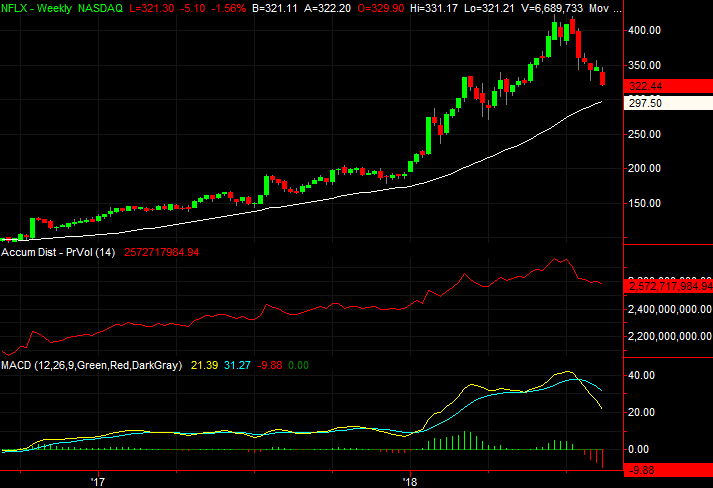
Stock Charts to Watch: Netflix (NFLX)
A month ago, Netflix shares plunged in response to a quarterly earnings report that pointed to slowing subscriber growth. Not surprisingly, the stock bounced back that very day, only to rekindle the downtrend the next day and move to an even lower low.
That pullback ended up with a rebound effort as well, but like the first one, this one soon buckled and resulted in yet another “lower low.” This second trip into lower-low territory largely confirms that the downtrend has taken hold.
Click to Enlarge
- The line in the sand was $328.29 (red, dashed), where NFLX hit a low and bounced late last month. That floor was broken on Wednesday, and then decidedly broken as a floor on Thursday.
- The daily chart also subtly hints that there have been and continue to be more sellers than buyers. None of the bounce efforts were on strong volume, and the Chaikin line is now trending lower again… already below the zero level.
- Zooming out to the weekly chart we can see just how overbought NFLX shares became over the course of the first half of the year. Ripe for a wave of profit-taking, now that it’s started to unravel, the easier it becomes for Netflix stock to continue unraveling.
Stock Charts to Watch: PG&E (PCG)
Most utility stocks like PG&E crashed early in the year, but not because the industry hit a wall. It had more to do with concerns that interest rates would rise unchecked.
Conversely, when investors realized interest rates wouldn’t scream higher as feared, dividend-oriented stocks, like utility equities, found a floor and started testing the waters of higher highs again.
Not all utility stocks have rebounded equally though. Many are well into their recoveries. PG&E, though, still has most of its road to recovery ahead of it rather than behind it. There’s just one more hurdle to clear.

Click to Enlarge
- With just a quick glance at the daily chart, it looks like PCG is simply volatile. A closer inspection, however, indicates that that the stock is being squeezed into the tip of a converging wedge pattern (red, dashed). The convergence sets the stage for a spring-loaded breakout.
- That spring is starting to uncoil now, with PCG shares having just pushed its way above the upper boundary of that wedge shape. The volume has turned increasingly bullish as well.
- The final line in the sand is the 200-day moving average line (white), at $45.09. If that ceiling is broken, months’ worth of brewing bullishness will be unleashed.
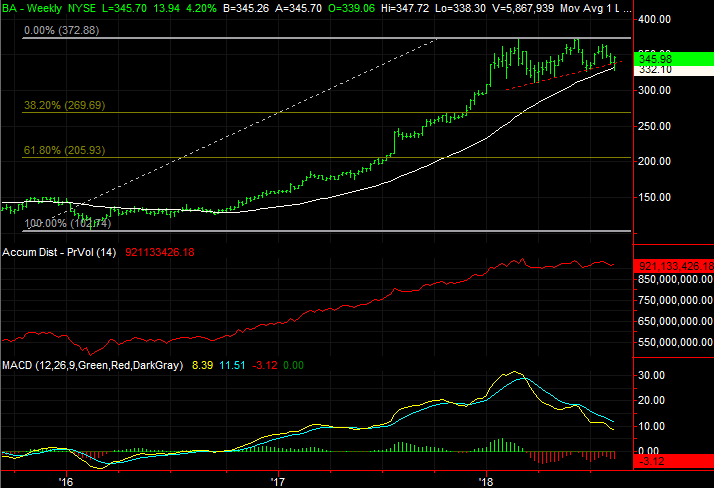
Stock Charts to Watch: Boeing (BA)
Finally, Boeing shot higher on high volume yesterday in response to a big upgrade from Morgan Stanley. And, with or without that affirmation, Boeing’s got a bright future.
From time to time, however, as a stock’s going to do what a stock’s going to do. And right now — barring something miraculous developing in the way of follow-through on Thursday’s action — last year’s big-time bullishness from BA stock could be close to unraveling. Once that selling starts, it will be tough to stop it.
Click to Enlarge
- The day before Thursday’s bounce, Boeing broke under an intermediate-term support line (red, dashed) and kissed the 200-day moving average line (white) for the first time since late 2016. It held up as a floor so far but remains within striking distance.
- It’s subtle, but weakness has been brewing for weeks. The stock’s other key moving averages are working their way closer to crossing below the 200-day moving average, confirming the kind of slowdown often seen before an outright trend reversal.
- The weekly chart’s Fibonacci retracement lines indicate the next most plausible floor is the 38.2% retracement line at $269.70. Should the 200-day average break down as support, that becomes a checkpoint target.
As of this writing, James Brumley did not hold a position in any of the aforementioned securities. You can follow him on Twitter, at @jbrumley.