Wall Street continues to send mixed messages heading into a pivotal decision from the Federal Reserve’s chiefs on Wednesday. Yesterday, the S&P 500 fell 0.13%, but the Nasdaq gained 0.18%. Decliners outnumbered advancers, but bullish volume outweighed bearish volume.
Although it’s not a Nasdaq-listed stock, Square (NYSE:SQ) did a lot of inspirational heavy lifting for the tech sector. Square was up nearly 11% after Nomura analyst Dan Dolev suggested it should become part of the market-leading FANG stocks. The power of association is strong. At the other end of the spectrum, the 4% setback General Electric (NYSE:GE) suffered on Tuesday was simply more of the same, as investors digest the actual net cost of the recently discovered problem with its natural gas turbines.
Today’s top prospects are Verizon Communications (NYSE:VZ), ConocoPhillips (NYSE:COP) and Lockheed Martin (NYSE:LMT). Here’s a closer look at the key stock charts of each.
Verizon Communications (VZ)

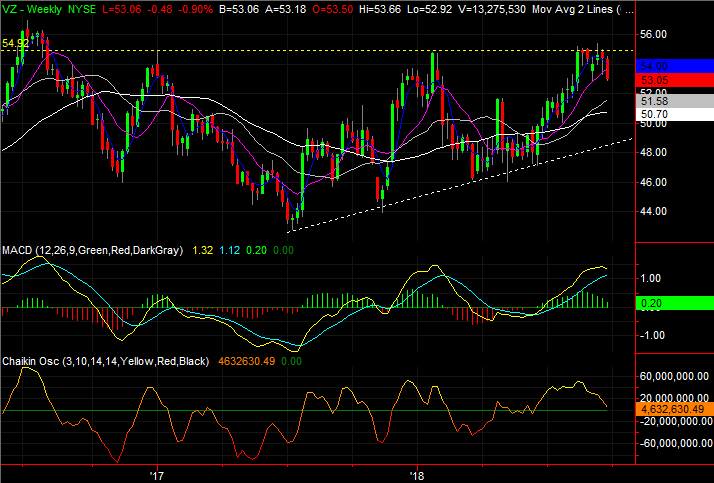
A month ago, it looked like Verizon shares were finally going to hurdle a major technical ceiling around $55. That area had capped a couple of rally efforts since early 2017, but with a string of higher lows in its wake and lots of momentum, the rally’s pause at $55 beginning late last month only felt temporary at the time.
Now it looks like it was all just another fakeout. Thanks to Tuesday’s 0.9% slide, Verizon shares are under one key support level and knocking on the door of another one.
Click to Enlarge
• Zooming out to the weekly chart of Verizon we can see the basis for this effort to break above $55. The string of key lows since mid-2017, plotted with a white, dashed line, laid the groundwork for the bullish move. It’s since become a plausible downside target.
• That said, VZ isn’t quite in fell selloff mode yet. In the weekly timeframe, a bearish MACD cross and a move back below zero for the Chaikin line would confirm the downtrend was in full swing.
ConocoPhillips (COP)
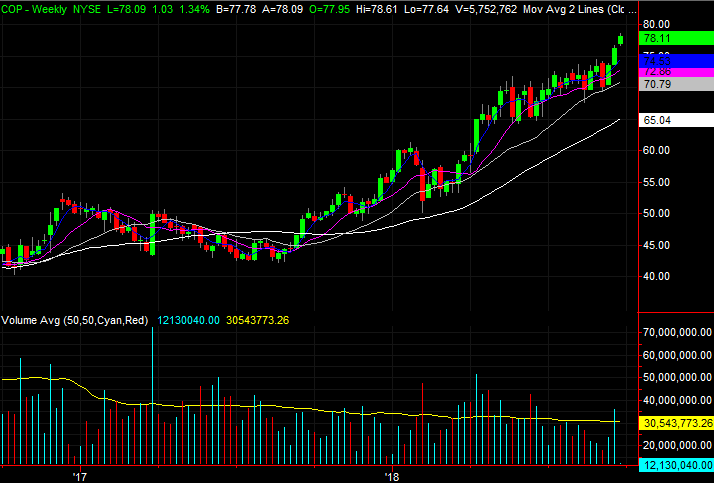
The energy sector has been amazingly bullish over the course of the past few days, in step with rekindled strength in oil prices. ConocoPhillips hasn’t been an exception to this norm.
If you look closely at the shape of the bars COP has been logging though, and really study those subtle clues, you’ll find not all of these buyers are completely convinced COP is safe enough to keep buying into here.
Click to Enlarge
• At the same time, though Friday of last week proved to be an exception, the volume behind the rally since early September has been unimpressive (and last Friday’s volume surge was almost entirely attributable to the triple-witching effect, and had nothing to do with ConocoPhillips itself.)
• Regardless of what happens from here, notice how well the gray 100-day moving average line reversed recent pullbacks. It may well do it again.
Lockheed Martin (LMT)
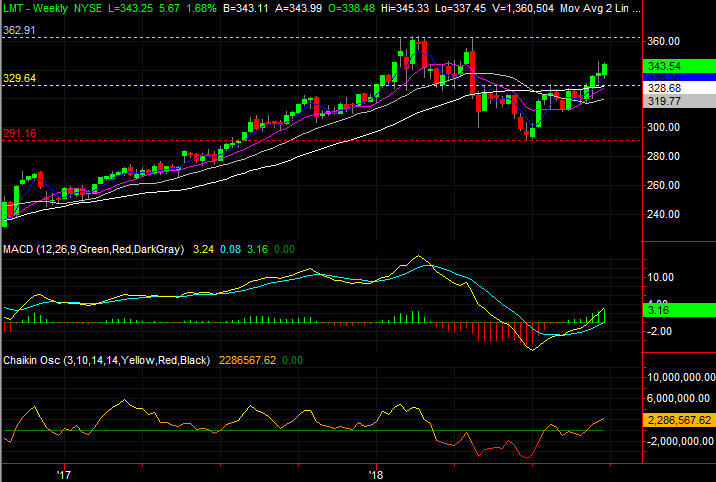
Last but not least, in mid-September Lockheed Martin was pegged as a budding breakout candidate. LMT shares had just poked above a major resistance line, and given the buildup the stock’s chart mapped out leading up to that thrust, it was likely to keep chugging for a while.
Things panned out as expected. In fact, even though the sellers pushed back just a few days later, the bullish bounce since then underscores the strength of the initial bullish push.
Click to Enlarge
• Though it’s only tentative, the $382 area would be a good “checkpoint” target, meaning reassess the strength of the uptrend if and when LMT gets there. That’s where the stock topped out a couple of times earlier this year.
• Adding to the notion that $382 is at least a near-term target is the fact that the head-and-shoulders pattern, marked with pink arrows spanned about $35, so the subsequent break above the yellow neckline should also set up a move of about the same distance.
As of this writing, James Brumley did not hold a position in any of the aforementioned securities. You can follow him on Twitter, at @jbrumley.