All in all, Friday’s action was a less-than-thrilling end to a less-than-thrilling week that in turn ended a so-so month. Although the S&P 500 broke even on the last trading day of last week, stocks lost ground last week, just a week after they moved into record-high territory.
Advanced Micro Devices (NASDAQ:AMD) gets most of the blame for the broad market’s lackluster action. It lost 5.2% on Friday after Intel (NASDAQ:INTC) reported it wasn’t facing the production capacity problems investors had been led to expect. Intel, conversely, gained 3.1% on the news. That and the 5.1% rally from Nvidia (NASDAQ:NVDA) still wasn’t enough to push the market all the way into the black on Friday, however.
None of them are particularly compelling trading prospects headed into this week’s action though. Rather, stock charts of Interpublic Group of Companies (NYSE:IPG), Activision Blizzard (NASDAQ:ATVI) and S&P Global (NYSE:SPGI) look most interesting
.
Activision Blizzard (ATVI)

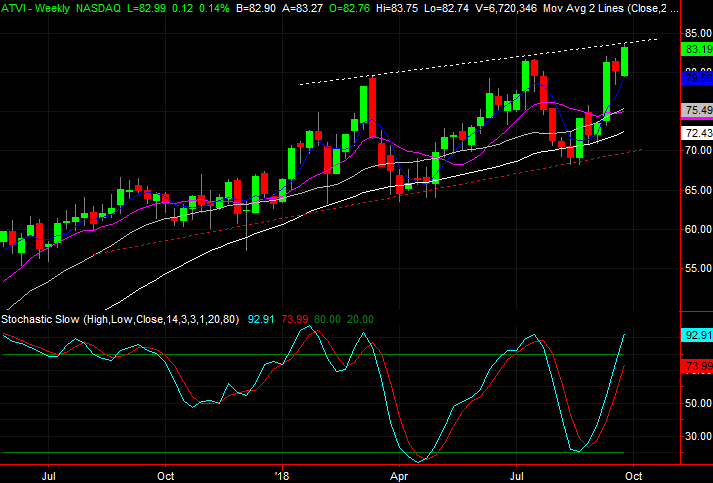
The last few weeks have been outstanding ones for Activision Blizzard shareholders. ATVI shares have rallied 22% from their August lows, and still appear to be going strong.
It’s a move shareholders have seen before, however, to no avail. In fact, traders have seen this exact same move before — recently — turn around and unravel these big gains. Worse, ATVI is right at the place where one would expect the profit-takers to dig in.
Click to Enlarge
• The good news is, there’s a support line working in conjunction with the upper edge of the recent trading range. Plotted with a red, dashed line on the weekly chart of Activision Blizzard, any selloff is likely to end there.
• Though it’s the much less likely outcome, a move above the technical ceiling that was brushed on Friday could be a bullish catalyst… even if only a short-term one. Be ready for contingency at this proverbial fork in the road.
S&P Global (SPGI)
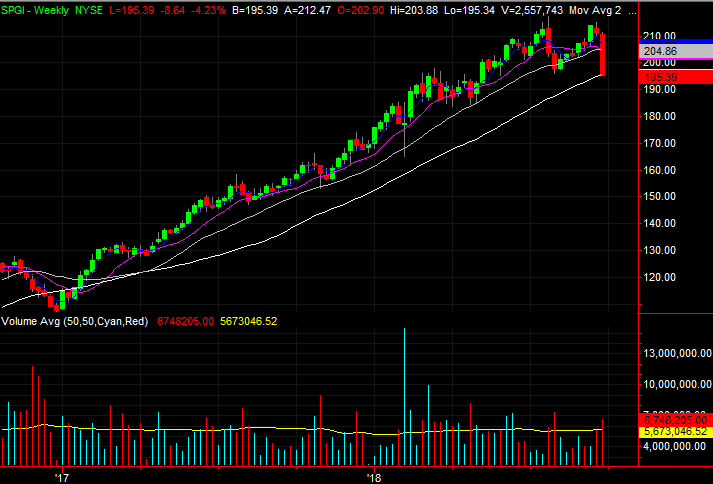
S&P Global shares got hit hard on Friday … real hard. It wasn’t just a bad day though. Thanks to that 4.2% tumble, SPGI was dragged down to the last of its major technical support lines. Maybe it will bounce back just as sharply, and maybe not. Either way, with the rubber band pulled as tightly as it is right now, the rubber band is either going to snap, or catapult the stock back into its long-term uptrend.
Click to Enlarge
• With or without a cross of the 200-day moving average line, SPGI has already fallen under other key moving averages that had previously been support lines. In fact, the purple 50-day moving average line is on the verge of breaking below the gray 100-day moving average line for the first time since early 2017.
• The stock may pop back up from Friday’s drubbing, but don’t read too much into that bullish pushback. It might just be a dead-cat bounce. The question is whether or not that bounce can rekindle the uptrend. It may take two efforts to pull SPGI below the 200-day moving average line.
Interpublic Group of Companies (IPG)
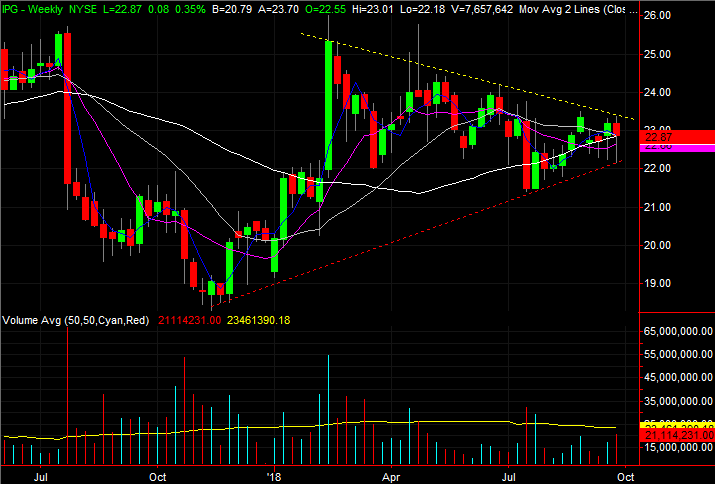
Last but not least, Interpublic Group of Companies shares are at a tipping point. It’s not clear which side of the fence the stock’s going to fall on. But, it is clear that with no room left to bounce around between converging support and resistance lines, the resulting move could be explosive and trade-worthy.
Click to Enlarge
• The convergence of all the key moving average lines is also telling. Periods of high volatility are followed by periods of low volatility, and vice versa. Now that all are intercepting one another, it’s time for a new divergence.
• Though it’s possible Interpublic Group of Companies shares could fall below the lower edge of the wedge pattern and start a sizeable move lower, the odds seems to favor a breakout above the upper boundary. We’ve seen two major accumulation (high buying volume) days in the past couple of weeks, and the sheer scope of Friday’s intraday reversal indicates the bulls are willing to put up a fight.
As of this writing, James Brumley did not hold a position in any of the aforementioned securities. You can follow him on Twitter, at @jbrumley.