Wednesday was the second winning day for the S&P 500 this week, but like the other two trading sessions, it has been a struggle. All the indices once again peeled back from intraday highs, with the bulls unwilling to keep the pressure on through the closing bell.
Bank of America (NYSE:BAC) did a great deal of the heavy lifting, gaining 1.4% as investors realized they’ve been overly tough on banks of late. At the other end of the spectrum, Advanced Micro Devices (NASDAQ:AMD) arguably did the most damage, losing 2% of its value as traders continue to rethink they’re unquestioned bullishness on the stock of late.
As for Thursday’s best bets, take a look at stock charts of Lennar (NYSE:LEN), Kinder Morgan (NYSE:KMI) and International Paper (NYSE:IP). A couple of them have fallen past the point of no return, while the third one is setting up a breakout thrust.
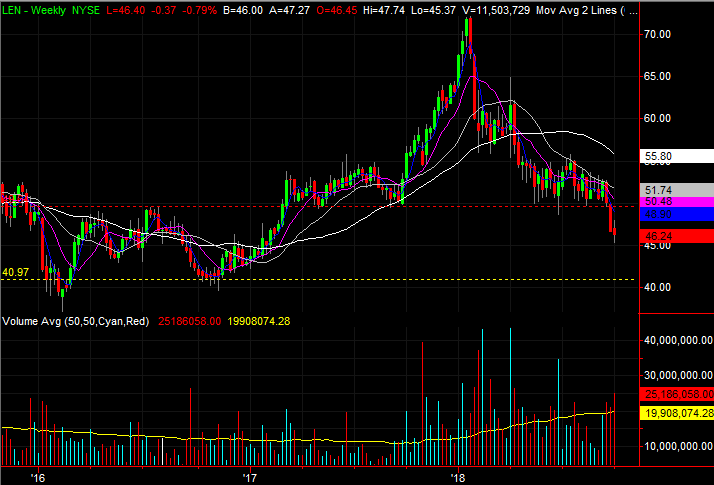
Lennar (LEN)

When we last looked at Lennar back on Sept. 21, it was putting pressure on a major support line at $50 but had not yet broken under it. Given the selling pressure that was being persistently applied, though, it appeared like that breakdown was inevitable. That breakdown ended up taking shape two trading days later, and as suspected, the follow-through was significant.
For a brief while over the course of the past few days it looked like the bulls were finally ready to stop the bleeding. With Wednesday’s action in the rear-view mirror, however, traders may want to gear up for another round of selling.
Click to Enlarge
• The telling sign here, however, is the sheer degree of volume behind the selloff and the fact that the bearish volume continues to grow. There may be even more sellers waiting in the wings.
• Zooming out to a weekly chart, we can see that the recent pullback completes a head-and-shoulders pattern that began to form back in early 2017. That setup bolsters the bearish case now.
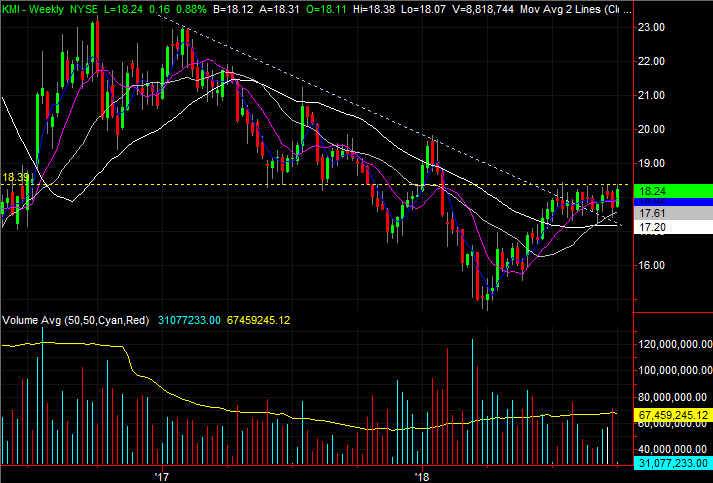
Kinder Morgan (KMI)
Most oil and gas stocks have been dishing out gains of late, in step with rising crude and natural gas prices. Pipeline company Kinder Morgan hasn’t been an exception to that norm.
Kinder Morgan shares are taking on a slightly different and telling shape though. They’ve not made any net progress since July, but with three months of consolidation setting up a make-or-break technical resistance line, one good nudge could open the buying floodgates.
Click to Enlarge
• If the right catalyst was all that was needed, it may have materialized last week. That sharp pullback only had to kiss the gray 100-day moving average line to draw in another round of buyers.
• In the weekly timeframe, we can see Kinder Morgan has already broken above the falling resistance line that had been guiding it lower since early 2017.
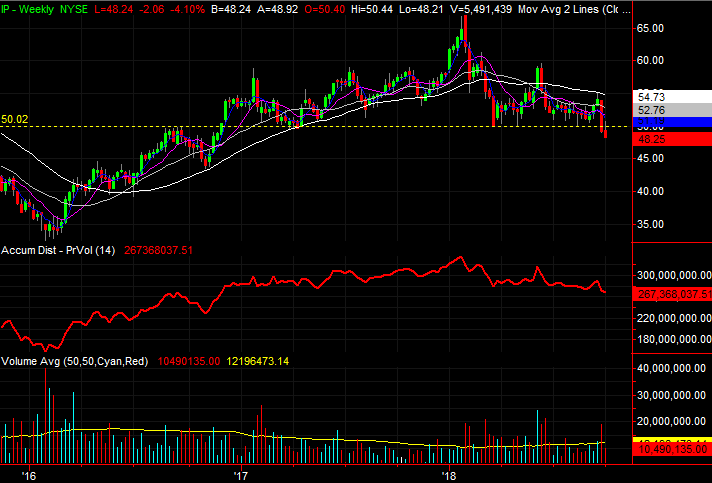
International Paper (IP)
Last but not least, International Paper was one of the three stock charts in focus back on Sept. 28. At the time, IP was close to breaking below a well-established technical floor, but had not yet done so. It happened that very day.
That’s not the most interesting, and bearish, part of the International Paper story, however. In fact, IP started to recover the very next day. It was Wednesday’s follow-through that sealed the bearish deal and set the stage for more selling ahead.
Click to Enlarge
• The surge in selling volume since the selloff late last month leaves little doubt that investors really, really can’t get rid of this stock fast enough.
• Zooming out to a weekly chart we can see that not only has International Paper completed a head-and-shoulders pattern, but that there’s a great deal of room for it to keep falling. There’s no prior low point in a position to act as a floor anywhere nearby.
As of this writing, James Brumley did not hold a position in any of the aforementioned securities. You can follow him on Twitter, at @jbrumley.