It may have only been a half day sandwiched between a weekend and a holiday, but in just that short period of time, the bears were able to tack on fair amount of losses. The S&P 500 ended Friday’s action at 2632.56, down 0.66% to cap off a sizable full-week loss and log the lowest close since May.
Doing the bulk of the net damage was Apple (NASDAQ:AAPL), falling 2.5% most only the heels of news that it was discounting the iPhone XR in Japan due to poor sales. General Electric (NYSE:GE) technically logged the bigger loss, however, closing 3%, making its lowest close since 2009 as the market increasingly prices in rising odds that it won’t be able to dig its way out of its hole.
There were some winners. Rockwell Collins (NYSE:COL) gained 9.2% after China greenlighted its acquisition by United Technologies (NYSE:UTX). There were just fewer winners than losers on Friday, however, leaving most stock charts poised to move even lower even if the broad market is ripe for a bounce. Among the most noteworthy names on the verge of even bigger trouble are Visa (NYSE:V), Copart (NASDAQ:CPRT) and Paypal Holdings
(NASDAQ:PYPL). Here’s why.
Visa (V)

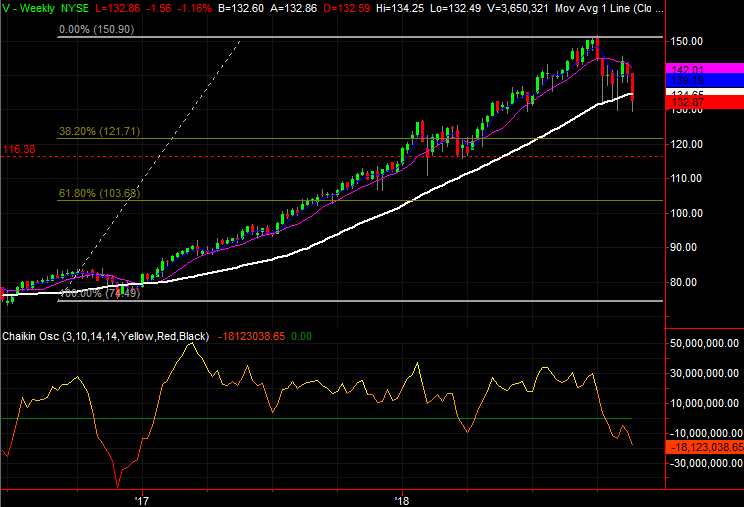
In mid-October, Visa looked like it was in trouble, only to turn things around right before falling under the pivotal 200-day moving average line. That bounce effort has petered out again though, letting V shares slide back below the 200-day line.
This time, though, the event is framed by an even uglier backdrop. A rebound is even less likely now, and there’s plenty of room for more selling.
Click to Enlarge
• On the daily chart, we’ve already seen or are nearing key bearish crosses of moving average lines. In particular, the pink 50-day moving average line is about to move below the 100-day moving average line.
• The most plausible landing points, if this selling keeps going, are the Fibonacci retracement line at $121.70 or March’s turbulence around $116.
Copart (CPRT)
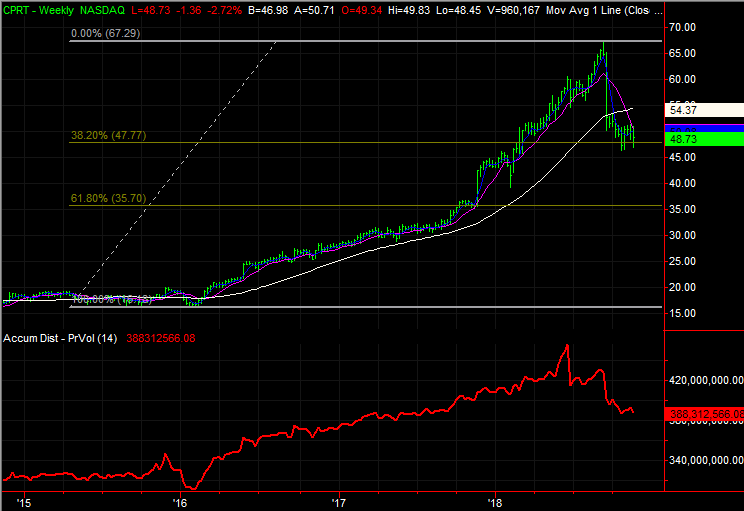
Back in early October, Copart shares tried to turn things around from a rough September, but were struggling to do so. Namely, after falling under it in September, CPRT shares struggled to crawl back above the 200-day moving average line that’s plotted in white on the daily chart.
Since then, Copart has broken under the technical support level around $51, marked with a dashed line. Worse, that floor has since been defined as a ceiling that’s giving the bears a chance to regroup and set the stage for another bearish leg.
Click to Enlarge
• The slowdown in the selling isn’t a complete surprise. The recent lows are right around the 38.2% Fibonacci retracement line at $47.80, which is based off of the major low in early 2016 and this year’s high.
• The trigger for the next wave of selling may well be a break below October’s low around $46.20, plotted with a red dashed line.
Paypal Holdings (PYPL)
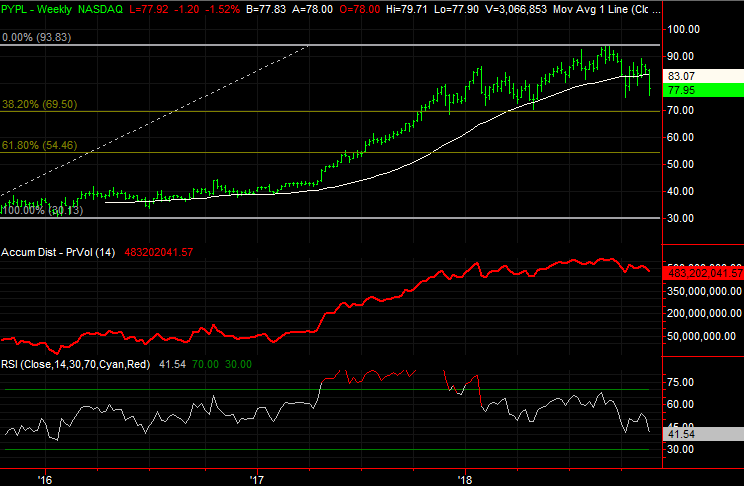
Finally, with just a quick glance, Paypal Holdings shares look like they’re just going through a volatile patch. And, maybe that’s all this is.
Given all the bearish crossunders of key moving average lines we’ve seen since October, though, it might be wise to respect the possibility that the undertow has changed direction. One more downward move could break a key technical floor and open the selling floodgates.
Click to Enlarge
• In the meantime, the purple 50-day moving average line has fallen below the gray 100-day average, and is on the verge of moving below the white 200-day moving average line … a so-called death cross.
• The weekly chart not only puts it all in perspective, but also shows where the next potential support level is. It’s the $69.50 area, where PYPL found support several times a few months ago, and where the 38.2% retracement line presently lies.
As of this writing, James Brumley did not hold a position in any of the aforementioned securities. You can follow him on Twitter, at @jbrumley.