The market tried to turn Monday’s drubbing around on Tuesday. But, when push came to shove, it was the bears doing most of the shoving. The S&P 500 closed at 2722.18 yesterday, down 0.15%, led lower by Amarin Corporation (NASDAQ:AMRN) and Apple (NASDAQ:AAPL). Amarin fell more than 22% in response to a concerning update on one of its key drug trials.
Curiously though, there was more bullish volume on Tuesday than bearish volume, and only a few more falling stocks than rising stocks. General Electric (NYSE:GE) was up nearly 8% as investors went bargain shopping following Monday’s continued meltdown.
None of those tickers are particularly well positioned as good trading setups headed into hump-day though. Rather, it’s stock charts of HollyFrontier (NYSE:HFC), PPL (NYSE:PPL) and Home Depot (NYSE:HD
) that hold the most promise, as they’ve all formed some familiar setups.
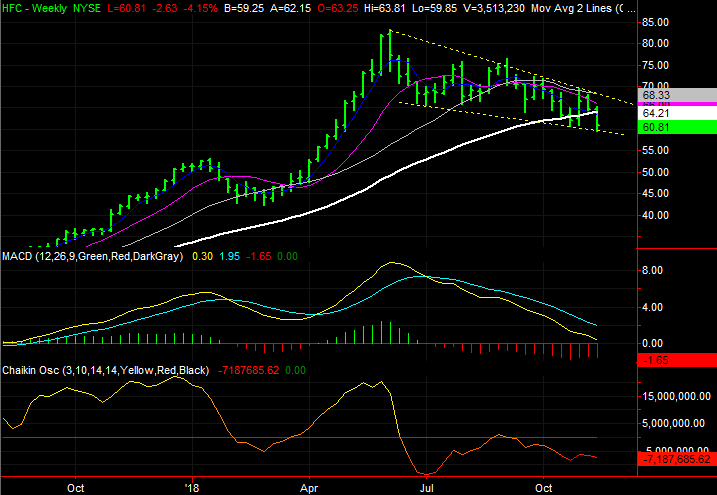
HollyFrontier (HFC)

It has probably got more to do with the brewing weakness with the whole energy sector than with HollyFrontier in particular. But, the reason is irrelevant.
What matters most is what’s happening, and the fact that HFC shares are just one more stumble away from getting into a “bad to worse” situation.
Click to Enlarge
• Though the lower edge of that bearish trading range was kissed on Tuesday, yesterday’s weakness also pulled HFC under the critical 200-day moving average line, in white, for the second time in three weeks.
• While the bulls will likely push back a bit, until HollyFrontier breaks all the way above a convergence of resistance all around $68, the threat of a break below $60.60 (give or take) is too significant to ignore.
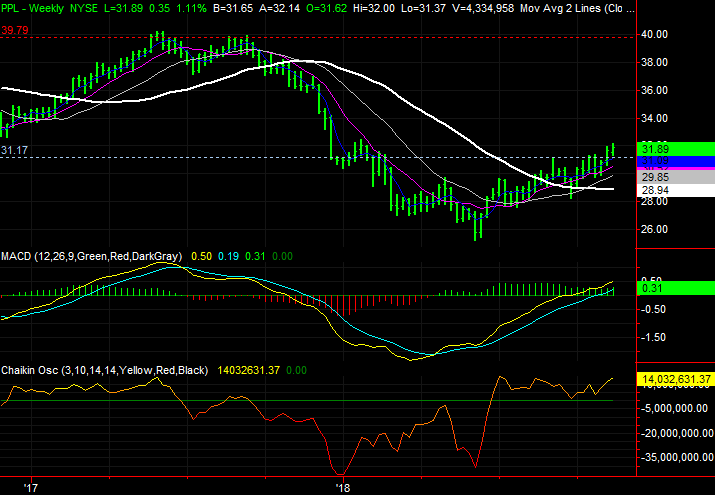
PPL (PPL)
More than once within the past several weeks we’ve look at utility stock PPL, pointing out how well-grounded the budding rally was, and how close it was to a break above a pretty important technical ceiling.
That happened in earnest last week, but it’s what happened in the meantime that’s so enticing. Without even blinking, the buyers kept wading into the stock. That move appears to be celebrating now, and there’s a ton of room to keep rolling.
Click to Enlarge
• This is a well-grounded breakout thrust too, pushing up and off key moving average lines multiple times along the way. Those pushoffs are highlighted on the daily chart.
• Zooming out to the weekly chart makes it clear there’s no previous area of turbulence that’s apt to stop a rally effort in its tracks.
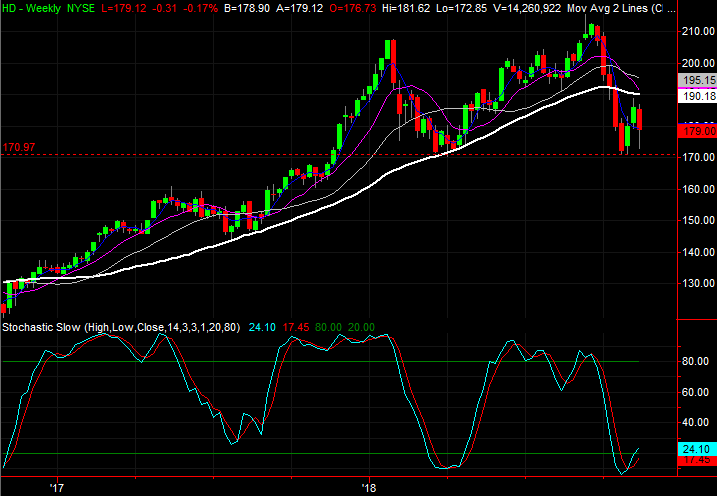
Home Depot (HD)
Last but not least, with just a quick glance it doesn’t appear Home Depot did much of anything yesterday other than lose ground. Shares ended the day with a loss of 0.24%, and the bears were plentiful, judging from the volume.
There were some oddities with Tuesday’s trading action, however, that suggest the steep selloff and partial clawback is actually going to serve as a pivot point out of a downtrend and into an uptrend.
Click to Enlarge
• If this is indeed a reversal, it’s the perfect place to make one. Last month’s low is in line with the March low, and Tuesday’s low was in line with last month’s lowest close.
• Nevertheless, this is a setup that requires confirmation in the form of bullish follow-through.
As of this writing, James Brumley did not hold a position in any of the aforementioned securities. You can follow him on Twitter, at @jbrumley.