It could have been worse yesterday, but for a good part of Tuesday’s action, it was much better. The S&P 500 basically closed at a breakeven yesterday, at least quelling the downtrend … for the time being. It’s just encouraging that at least some stocks — even if not all stocks — are able to make forward progress again.
General Electric (NYSE:GE) was, amazingly enough, one of the big winners for a second day in a row. GE stock gained another 1.8% for no particular reason. Investors are simply starting to think the company’s current situation is about as bad as it gets. Other winners included Advanced Micro Devices (NASDAQ:AMD) and Microsoft (NASDAQ:MSFT). The former gained 3.6% and the latter was up 1.1% primarily because enough traders were once again seeking out growth names in anticipation of a broader rebound in the works.
At the other end of the spectrum, Philip Morris (NYSE:PM) weighed the market down with its 7.6% loss stemming from a downgrade by Credit Suisse.
At the very least, the marketwide rout is cooling off. The winners and losers are starting to separate themselves. And the stock charts of Nike (NYSE:NKE), Johnson & Johnson (NYSE:JNJ) and Facebook
(NASDAQ:FB) are part of the delineation. Here’s how.
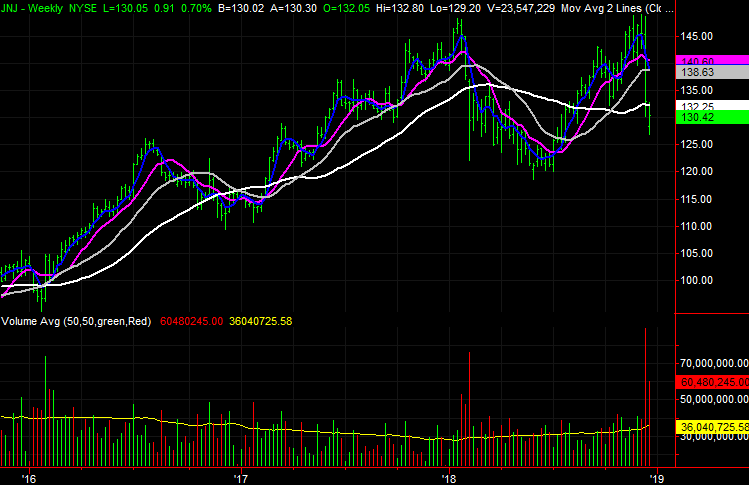
Johnson & Johnson (JNJ)

On Friday of last week, a Reuters report rocked Johnson & Johnson shares. As had been rumored but not explicitly put in print, the investigative report firmly claimed the company at one point did indeed know there was a risk that asbestos tainted some of its talcum powder. Shares fall 10% that day.
Though certainly embarrassing, the big stumble also prompted some observers to say the stock was a buy whether or not the allegations had merit. What the stock did on Monday and Tuesday, however, implies it’s not ready to rebound just yet.
Click to Enlarge
• As the weekly chart illustrates, however, JNJ has been broken before, and it recovers fairly quickly en route to higher highs.
• Johnson & Johnson is in limbo for the time being, but should shares break under Monday’s low around $126.68, gravity could take over.
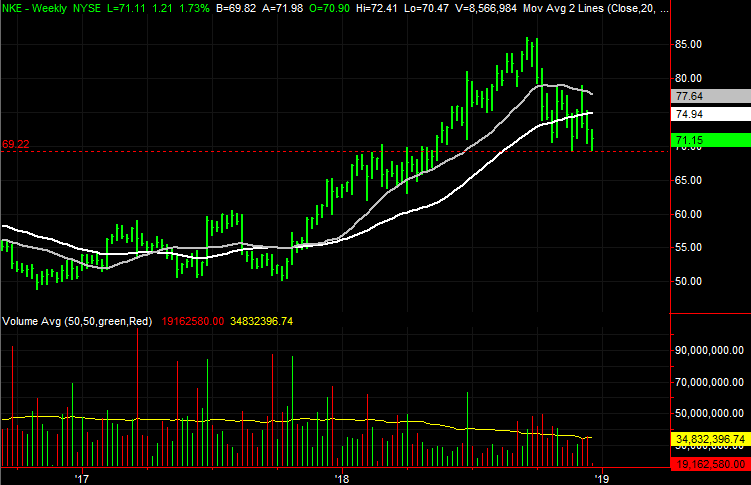
Nike (NKE)
Nike may be the undisputed king of the athletic apparel market, but unless investors persistently believe that, it’s a reality that doesn’t do the stock any good.
Right now, investors don’t believe it, and that’s causing problems for NKE shares. In fact, we’ve seen some huge technical damage inflicted on Nike stock in just the past few days, and shares are on the brink of going from bad to worse.
Click to Enlarge
• As of today, the stock is now lying in the shadow of a so-called death cross, where the purple 50-day moving average line falls below the white 200-day moving average line. These are cues of well-developed momentum.
• Shares have found a floor around $69.44, plotted with a red dashed line, twice since last month. The bulls may not hold the line there a third time, sparking a more serious selloff of a huge rally though the first three-fourths of the year.
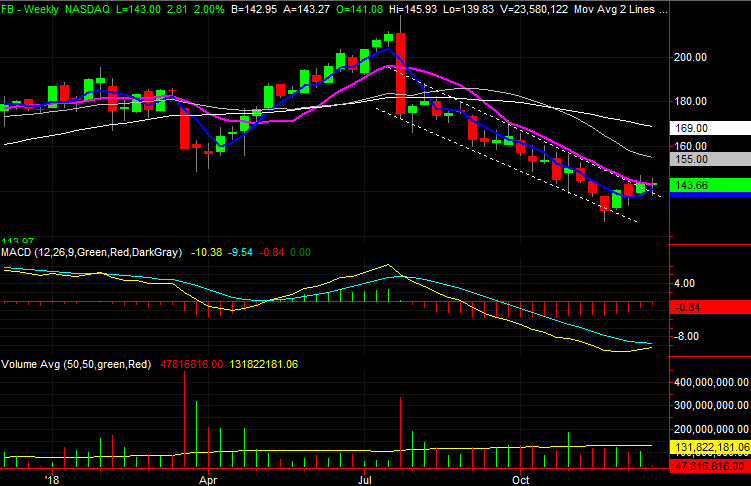
Facebook (FB)
As of the middle of November, Facebook shares were in serious trouble. Plagued by a few too many gaffes that were drawing more and more scrutiny from lawmakers, the market feared the worst.
Traders have changed their mind, at least partially, in the meantime though. It’s not over a key hurdle yet, but it’s in a position to do so. It belongs on watchlists if only to see if that’s going to happen.
Click to Enlarge
• On the other hand, the blue 20-day moving average was just confirmed as a floor. This could keep shares in position until they’re ready to hurdle the 50-day average (though if the support provided by the 20-day moving average line buckles, that could be trouble).
• As the weekly chart shows, the recent strength has already pushed FB stock out of a falling trading range framed with white dashed lines. It’s not a clean break, but it’s a start. A bullish MACD cross in the weekly timeframe looks imminent.
As of this writing, James Brumley did not hold a position in any of the aforementioned securities. You can follow him on Twitter, at @jbrumley.