After a record-breaking day on Wednesday, stocks are slumping on Thursday. All hope is not lost as the markets aren’t giving back all of the prior day’s gains. But the decline is certainly sapping some of the enthusiasm out of the market. Let’s look at a few must-see stock charts for Friday, the second to last trading day of 2018.
Must-See Stock Charts for Tomorrow #1: Nvidia
Click to Enlarge
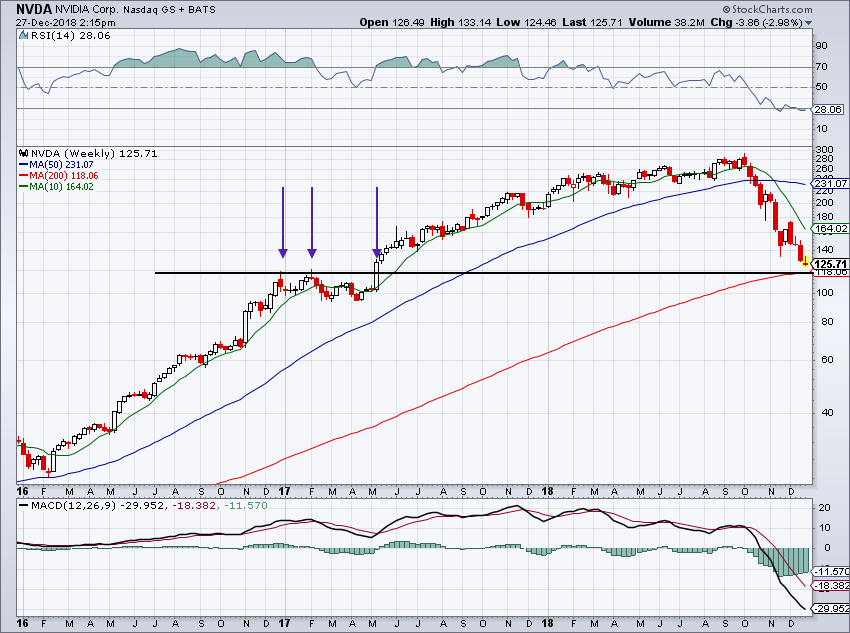
What was once the tech darling bulls adored has turned into one of the most sour investments in tech. Shares of Nvidia (NASDAQ:NVDA) are down a whopping 55% so far this quarter, a nasty performance for investors that recently got long the name.
Now down four weeks in a row and 7 of the last 8, Nvidia could be coming into some big-time support. For starters, the 200-week moving average rests down near $118 and is trending higher. Second, $120 was a massive level of resistance in late-2016 and into 2017.
A retest of that level will hopefully act as support for the name, particularly in combination with the 200-week. If not? Well, we could see $90 to $100, technically speaking.
The $120 level should be good for a bounce, at the very least.
Must-See Stock Charts for Tomorrow #2: Advanced Micro Devices
Click to Enlarge
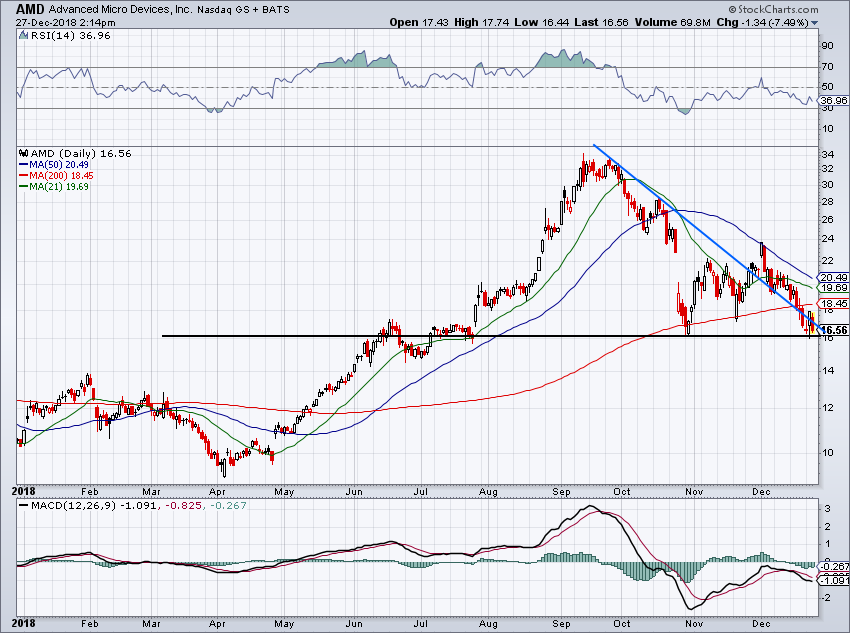
Performing almost as poorly as Nvidia this quarter, Advanced Micro Devices (NASDAQ:AMD) is down more than 46% so far in Q4. Does it have nearby support as well?
Well, the support isn’t as stiff as the one Nvidia is hovering above, but there is some hope. If AMD can stay above $16, bulls could construct a rally higher. However, that’s predicated on a larger bounce in the market, particularly with AMD stock down more than 7% so far on Thursday.
The decline put AMD back under downtrend resistance, although some investors could argue that the stock is still resting just above this level. Six months ago in a more forgiving tape, I likely would have drawn a more lenient trendline. In this type of market though, I’m conservative before I’m aggressive.
Below $16 and the $12.50 to $13 level could be on the table. A bounce here could send AMD back to the 200-day.
Must-See Stock Charts for Tomorrow #3: The VIX

Click to Enlarge
For AMD, we mentioned a market-wide bounce, but can we get it? One factor we can use to determine the market’s condition is the CBOE Volatility Index (INDEXCBOE:VIX), better known as the VIX.
The VIX acts as a “fear gauge” for Wall Street, falling in low volatility environments in rising during periods of elevated volatility. Of course, the former tends to happen when stocks are rising and the latter tends to be in play when stocks are dropping.
As you’ll see on the five-year weekly chart above, not once has the VIX closed north of $30 on a weekly basis. Will it this week? Short of a 10% decline on Friday, the index will do so for the first time in a while. While the VIX may or may not do so, it’s still at a pretty elevated level. While we could be entering a period of severe volatility, I would bet we get a pullback in the VIX before too long, which would likely coincide with an oversold rally in the stock market.
Must-See Stock Charts for Tomorrow #4: Blue Apron
Click to Enlarge
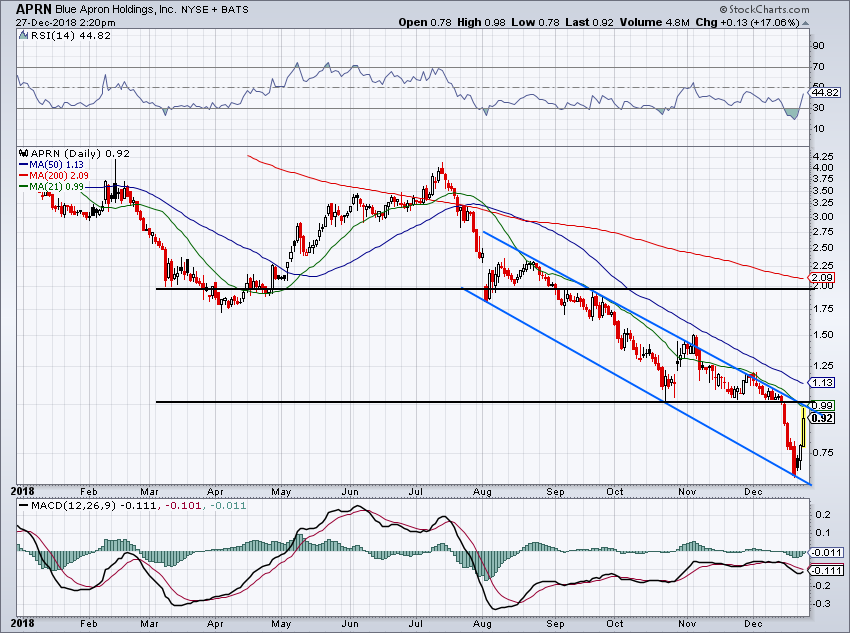
Shares of Blue Apron (NYSE:APRN) are up 21% to 93 cents a share in Thursday’s session after the announced a partnership with WW, Inc. (NASDAQ:WW), formerly known as Weight Watchers.
Is it enough to make it buy?
For the adrenaline traders out there, I wouldn’t touch APRN until its over a buck. Under $1.00 started the possible delisting phase, and there’s plenty of resistance overhead.
That said, if it can clear $1.00, it has a chance to challenge the 50-day moving average. Above that and hey, it’s possible that APRN is a double. But we’ll miss the first 20 cents of that move to find out if it’s for real or not before risking a move from 93 cents down to 70 cents or lower.
Must-See Stock Charts for Tomorrow #5: Roku
Click to Enlarge
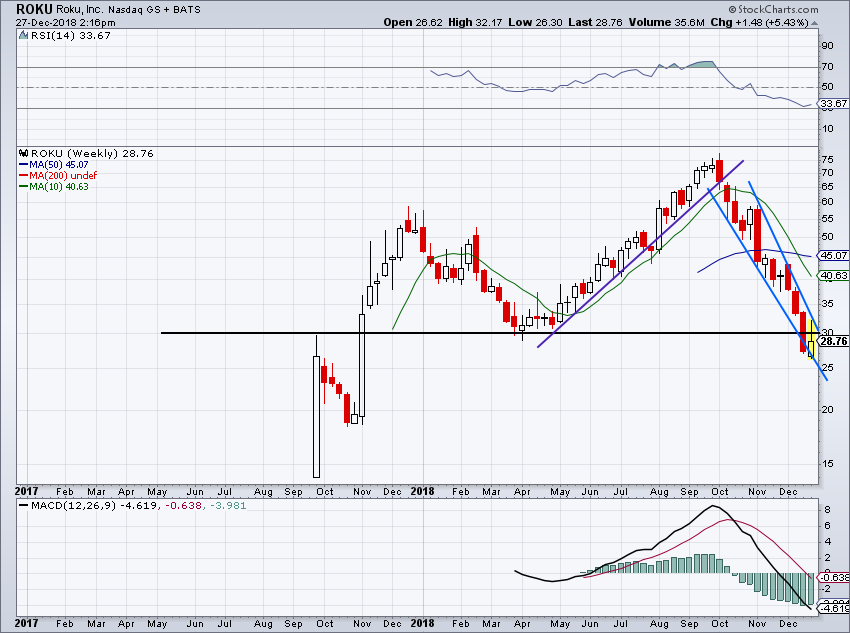
This stock is a tough one for me. I really like Roku (NASDAQ:ROKU) from a product standpoint and from a company standpoint. You’d think with this type of performance — down 62% this quarter — that there were some terrible earnings results in there.
But in fact, there were none. Last quarter, Roku reported strong results and raised its outlook. It’s just been caught up in a good old-fashioned rout. A perfect story of a good company and a broken stock. Of course, that does little to comfort those who are long.
From a trading perspective, this one’s still busted. A run above $30 failed miserably this week — that is, short of a big rally on Friday. Still, I don’t want to trade this one on the long side while it’s below $30. While it is down though, I do find it as an attractive investment. Over $30, bulls can get back on board.
Bret Kenwell is the manager and author of Future Blue Chips and is on Twitter @BretKenwell. As of this writing, Bret Kenwell was long NVDA and ROKU.