It was a gain, but not a convincing one. Yesterday’s 0.3% advance from the S&P 500 may have gotten it above the pivotal 200-day moving average line, but a huge chunk of the intraday move was ultimately given back, and the volume behind the gain was mediocre at best.
Still, baby steps in a bullish direction are still steps in the right direction.
General Electric (NYSE:GE) did a great deal of the work, up 3.9% mostly in response to a $92 billion backlog for its power division. That’s the arm that needs the most help and is best positioned for a turnaround.
At the other end of the spectrum, Teva Pharmaceutical (NYSE:TEVA) and Ambev SA (NYSE:ABEV) were a key part of the reason stocks struggled to make the collective gain they did. Ambev fell 2.4% mostly because traders remain unsure how they feel about the stagnant company, while Teva shares plunged 7.8% after the company conceded 2019 will be a “trough.” Investors were hoping the pivot had already been made.
None of those names are especially great trading prospects headed into Thursday’s session, however. Rather, stock charts of Intel (NASDAQ:INTC), Franklin Resources (NYSE:BEN) and Conagra Brands (NYSE:
CAG) are shaping up as the best bets. Here’s why, and what needs to happen next.
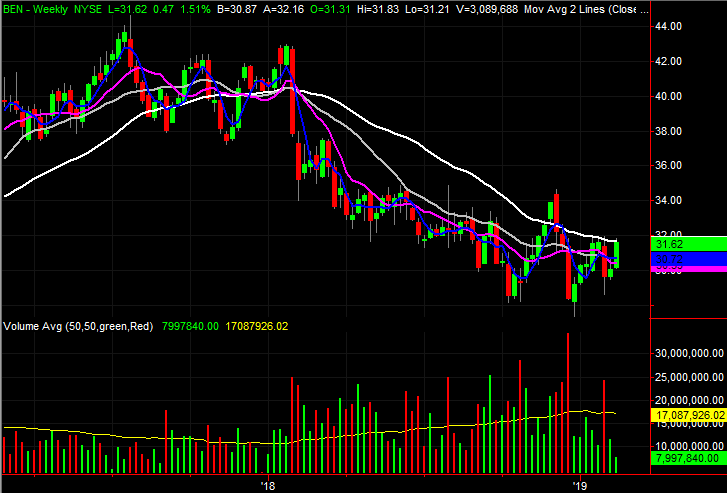
Franklin Resources (BEN)

With nothing more than a quick glance at Franklin Resources, it just looks like a volatile mess. And, that may be all it is. A closer look at the daily chart, however, reveals there may be more underway here than it seems on the surface.
The stock is at a key tipping point after Wednesday’s action, and the backdrop is surprisingly healthy.
Click to Enlarge
• It’s counterintuitive, but the volume surges that accompanied the last two major plunges are actually beneficial. They serve as a flushout, or capitulation, that cleared the decks for a new, net-bullish paradigm.
• Although the late-January low was the first higher low since mid-2017, the past two bullish efforts have been on tepid volume. More buyers will need to crawl out of the woodwork for a rally effort to be sustained.
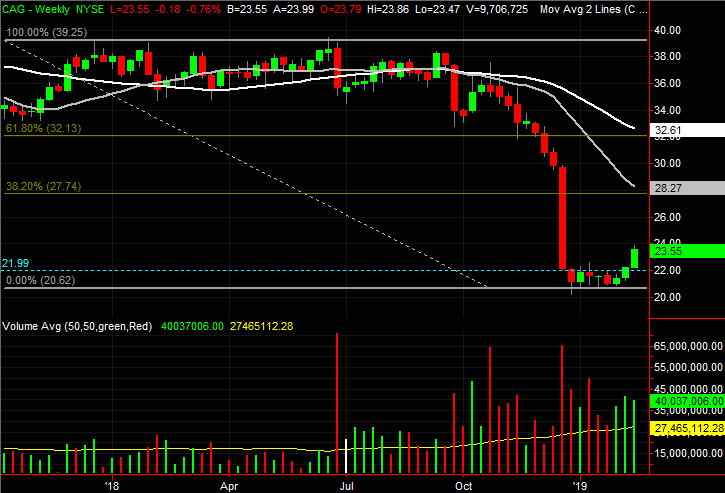
Conagra Brands (CAG)
A little over a week ago, Conagra Brands was featured as a budding breakout candidate. In fact, it had just edged above a technical ceiling. The effort just needed to solidify a little bit more, to confirm it was for real.
It’s for real. CAG is now up 6.5% since that look, and has put that resistance line in the rearview mirror. There’s another ceiling dead ahead, however, that needs to be cleared before the next bullish leg can take shape. Conagra may need to peel back before forging any higher though.
Click to Enlarge
• Although CAG may need to fall back and develop a running start to punch through that technical ceiling, the weekly chart makes clear the stock is more than oversold enough to fuel a bounce.
• Should Conagra make good on its promise, the next most plausible target is around $28. That’s where the first Fibonacci retracement line is, and where the gray 100-day moving average line is.
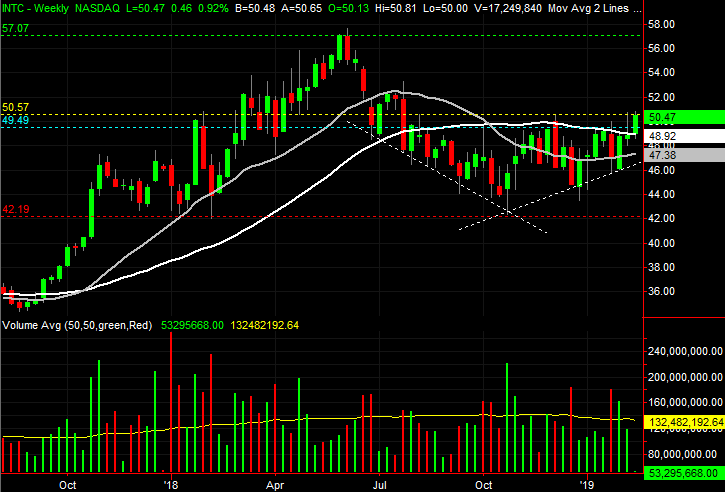
Intel (INTC)
Finally, Intel has been a name that’s been dissected several times in recent weeks, as the stock has been working on rocking its way out of last year’s pullback.
So far it hasn’t happened. But, this week’s bullishness has pushed INTC to the brink of moving all the way out of its recent technical confines. One more good day will get Intel up and over the final hurdle, unleashing a few months’ worth of pent-up buying action.
Click to Enlarge
• The trend paradigm has already shifted from a streak of lower lows to higher lows, which has pushed Intel shares above the pivotal 200-day moving average line, plotted in white.
• If a breakout move can take hold, the most plausible upside target is last June’s peak around $57. That $7 span between the current price and that target is more or less the same-sized span from the low and high seen as Intel worked its way through a triangle shape beginning in late June. That’s not coincidental. Stocks tend to move in familiar increments.
As of this writing, James Brumley did not hold a position in any of the aforementioned securities. You can learn more about James at his site, jamesbrumley.com, or follow him on Twitter, at @jbrumley.