Another day, another gain, though they’re increasingly tepid. The S&P 500 mustered a 0.18% advance yesterday, while the Nasdaq barely closed out in the black.
 CVS Health (NYSE:CVS) was the biggest drag. Shares of the drugstore chain fell more than 8% in response to a disappointing 2019 outlook.
Fortunately, there were enough names like Freeport-McMoRan (NYSE:FCX) and PG&E (NYSE:PCG) to keep the broad market out of the red. Freeport-McMoRan gained 2.1% yesterday, making good on the recent recovery hints the stock has dropped. PG&E, meanwhile, was up 2.7% on Wednesday as investors continue to have hope for life after bankruptcy. Citigroup upgraded it to a “buy” on Tuesday, anticipating its bankruptcy court proceeding would treat the company more gently than first presumed.
Headed into Thursday’s session, the stock charts of Intercontinental Exchange (NYSE:ICE), Western Digital (NASDAQ:WDC) and H & R Block (NYSE:
HRB) are of the most interest. Curiously, most of the best budding prospects are on the bearish side of the fence.
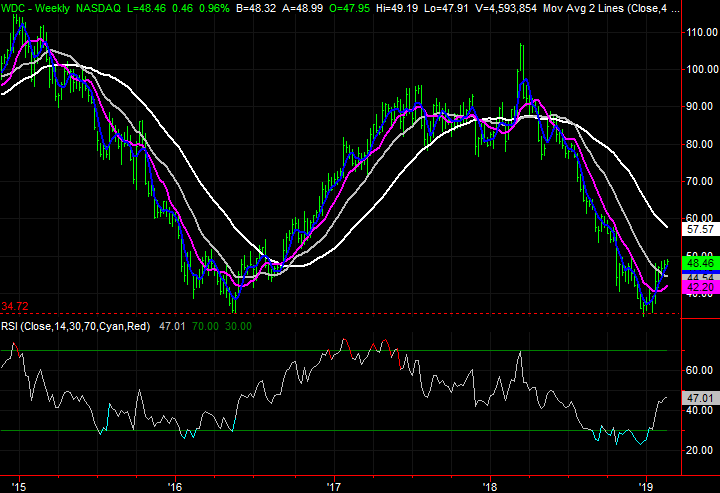
Western Digital (WDC)
Just a few weeks ago, Western Digital was untouchable. The computer storage industry was in trouble thanks to too much supply and too little demand.
Much has changed in the meantime. The rhetoric doesn’t suggest the foreseeable future will be more profitable than the recent past, but the chart says fresh money is being put back into the stock. There’s one last hurdle to clear, but there’s enough bullish momentum to get that rebound effort going in earnest.
Click to Enlarge
• Beckoning the stock higher from its current value is the gap that was left behind in October. The upper edge of that range is marked with a yellow line. Broadly speaking, the market doesn’t leave gaps unfilled.
• Zooming out to the weekly chart we can see the December low around $34.70 lined up with 2016’s low around the same. The bulls may have already planned a recovery effort here anyway, regardless of the rhetoric.
Intercontinental Exchange (ICE)
If Intercontinental Exchange rings a bell, there’s a reason. It’s one of the stock charts we’ve revisited multiple times in recent weeks, highlighting the fact that it’s increasingly toying with a breakdown.
That’s yet to happen. In fact, the couple of times since it’s been on our radar it looked like it was finally going to break down, it recovers. The tide, however, may have just flipped into a net-bearish position. One more floor needs to break first before the deal is sealed.

Click to Enlarge
• The weekly chart shows, with just a cursory glance, a slowdown of 2017’s and 2018’s momentum, but the selling doesn’t appear to be unmanageable yet. Take a closer look though, and you’ll see the purple 50-day moving average line just fell below the white 200-day average line… the proverbial ‘death cross.’
• Bolstering the bearish interpretation here is the fact that peer and rival CME Group (NASDAQ:CME) is behaving similarly. When stocks from the same group start to mirror one another, it’s often part of a sweeping tidal shift.
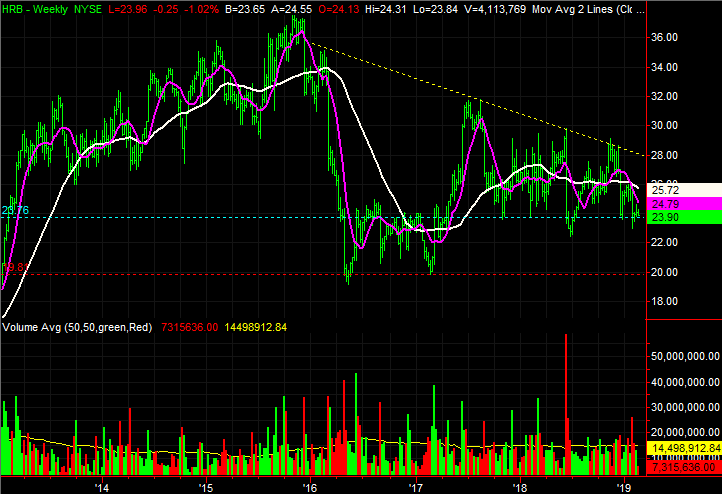
H & R Block (HRB)
One would think H & R Block shares would thrive at a time of year when taxes are on everybody’s mind. And, we’ve seen occasional flashes of bullish brilliance during the early parts of the year. None of them have really gone anywhere though, and of late, this has actually been a bearish time of year. Since 2016, February and March have been losers more often than not.
HRB stock is knocking on the door of making 2019 the third February/March loser in the past four years.
Click to Enlarge
• If the breakdown does end up taking hold, the next most plausible floor is the 2016/2017 lows just under $20.00, marked with a red dashed line.
• Still, H & R Block shares have been amazingly erratic, and unpredictable. Any trade must be monitored daily.
As of this writing, James Brumley did not hold a position in any of the aforementioned securities. You can learn more about James at his site, jamesbrumley.com, or follow him on Twitter, at @jbrumley.