Once again, the budding rebound effort was quelled. Yesterday’s 0.48% setback for the S&P 500, however, somehow seems to be more problematic than it normally might be given the way the market ha’s repeatedly stumbled since the beginning of the month. Investors are increasingly worried, and increasingly hedging.
 Cannabis company Cronos Group (NASDAQ:CRON) was one of the session’s biggest losers. Though it had a minimal impact on the overall market’s performance, its 10% tumble following a lackluster earnings report fanned the flames. Advanced Micro Devices (NASDAQ:AMD) took a smaller loss, but a bigger marketwide toll, losing 3.1% for no other reason than it’s a volatile market barometer, and an instrument of speculation.
Lululemon Athletica (NASDAQ:LULU) was at the extreme other end of the spectrum, gaining 2.3% during market hours but soaring more than 10% in after-hours action in response to an impressive fourth-quarter print. But, there weren’t enough names like Lululemon to keep the broad market out if the red on Wednesday.
Heading into Thursday’s trading action, stock charts of Pioneer Natural Resources (NYSE:PXD), Coty (NYSE:COTY) and Pfizer (NYSE:
PFE) have earned closer looks. Here’s what to note, and what may take shape next.
Pfizer (PFE)
In late January, we featured Pfizer as a bearish candidate. The stock had just made a lower low and lower high, and was testing support at the 200-day moving average line.
PFE stock broke below that long-term moving average line that very day… for exactly one day. The day after that, it was back above the 200-day moving average line. That rebound effort found resistance in some familiar places though, ultimately pulling Pfizer shares back to the brink of a major technical stumble. And, the bulls may not be as quick to stage a rebound effort should that floor be broken for a third time.

Click to Enlarge
• This potential move below the 200-day line, however, is happening in a different context than past ones. This time we’ve seen resistance at $43.74 cap two rebound efforts, and we’re still making lower highs.
• We’re also approaching a so-called “death cross,” where the purple 50-day moving average line is close to breaking below the white 200-day moving average.
• Should the budding breakdown take shape, the most plausible landing point is the support line that tags all the major lows from late-2016 on. It’s plotted in yellow on the weekly chart.
Coty (COTY)
Coty has been an intimidating stock to own since late February. Not one but two big bullish gaps remain in view, maintaining the prospect for a sharp pullback that will fill the gaps in.
It’s not an absolute rule that all gaps have to be filled in, however. This is one instance where it might not happen, particularly after seeing the bullish clues that have taken shape in the meantime.
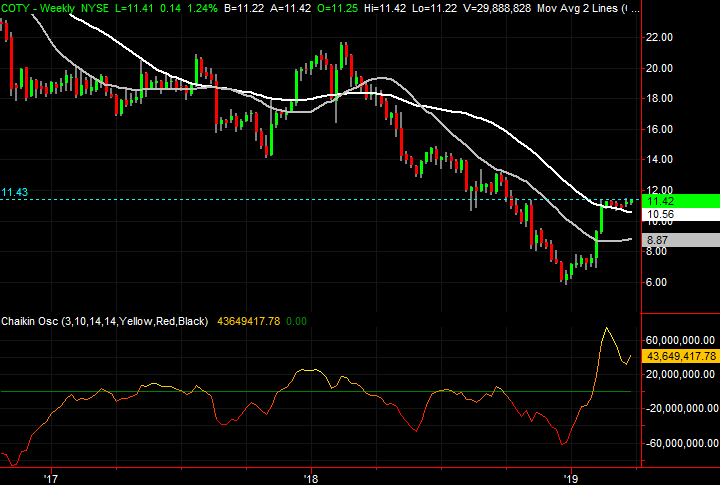
Click to Enlarge
• Simultaneously, since hitting a ceiling in mid-February and treading water in the meantime, for the second time in two weeks Coty stock has tiptoed above the established resistance around $11.40. That’s plotted in blue on both stock charts.
• Should this breakout effort take hold, the potential upside target is 2017’s range, between $18 and $20.
Pioneer Natural Resources (PXD)
Finally, most energy stocks are pushing higher, in step with a slow and uneven (but reliable) rebound in oil prices. That broad rising tide is a key part of the reason Pioneer Natural Resources is picking up steam.
But, PXD stock is unique in the sense that it’s one of the few oil and gas names with more room to rise in front of it than gains behind it. And, as of Wednesday, a long-awaited catalyst has been triggered with a near-perfect backdrop.
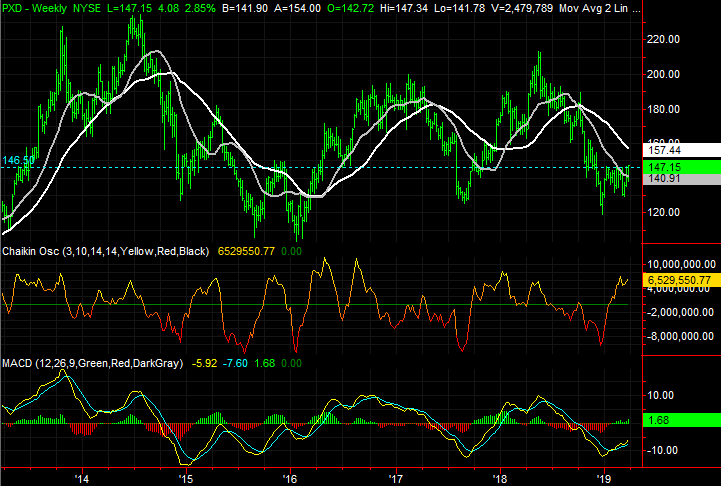
Click to Enlarge
• There’s solid, and growing, bullish volume on the way up. The accumulation-distribution line on the daily chart and the Chaikin line on the weekly chart both suggest there’s plenty of participation in the uptrend.
• The weekly chart makes clear that Pioneer is no stranger to big swings, both up and down. And, we’ve just come off of a key low, with lots of room to move back up to the upper side of a long-term trading range.
As of this writing, James Brumley did not hold a position in any of the aforementioned securities. You can learn more about James at his site, jamesbrumley.com, or follow him on Twitter, at @jbrumley.