The bears balked again, ceding control back over to the bulls on Wednesday … not that they did much with it. The S&P 500 mustered a gain of 0.35% yesterday, but hasn’t made any real net progress since late last week. Volume, already trending lower, was downright pathetic, with few traders interested in making a commitment.
 Bed Bath & Beyond (NASDAQ:BBBY) led the way, gaining more than 5% headed into its post-close earnings report. The stock gave up all of that gain and more in after-hours action though, following an unexpected quarterly loss. First Solar (NASDAQ:FSLR) logged an even bigger regular-hours gain though, advancing more than 8% after Goldman Sachs added it to its conviction list.
Lyft (NASDAQ:LYFT), on the flipside, was holding the market back, as shares of the newly minted ride-hailing stock fell more than 10% on the heels of news that rival Uber would soon be going public as well.
None of those names are setting up great trading moves headed into today’s action though. Rather, it’s the stock charts of Kellogg Company (NYSE:K), DISH Network (NASDAQ:DISH) and American Airlines Group
(NASDAQ:AAL) that are worth a closer look. Here’s what to look for.
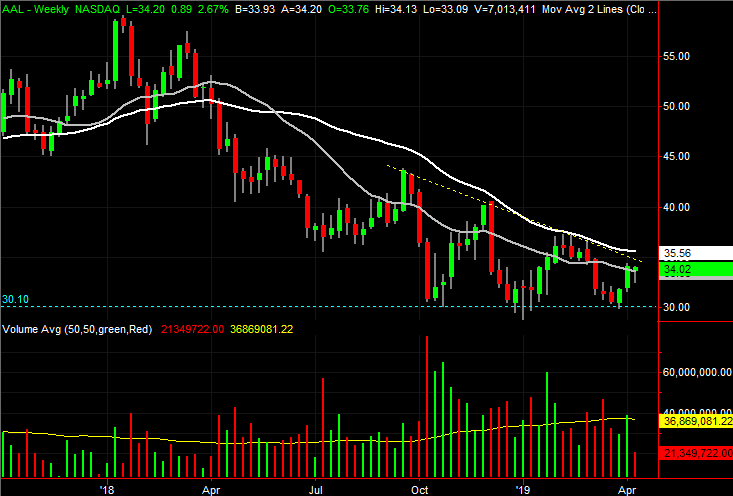
American Airlines Group (AAL)
Last year was a tough one for American Airlines Group shareholders. The stock was in a freefall for the better part of 2018, and though we’ve seen flashes of bullishness since October, nothing has actually shaken the stock out of its downtrend.
The prospect for a bullish reversal, however, hasn’t been better at any time in the past year and a half than it is now. There’s just a little more work that needs to be done.
Click to Enlarge
• The 200-day moving average line, plotted in white, may also serve as at least a temporary ceiling.
• Though the bulls need to secure more ground before the rally takes root, note that it has stopped making lower lows. A triple-bottom near $30 has been formed, which is a precursor to higher lows.
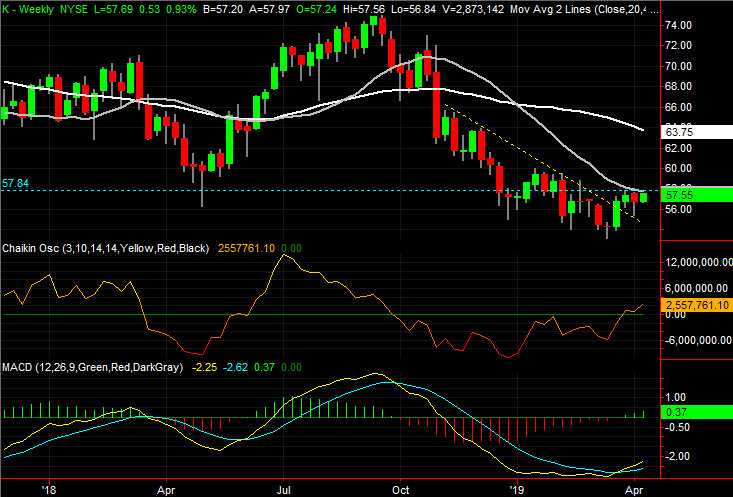
Kellogg Company (K)
Most stocks were hit hard in the latter part of last year. Kellogg Company was no exception. All told, it lost 28% of its value between September’s high and December’s low.
Matters have quietly started to improve though, and done so in the right way. One more good day could decidedly lock in place all the bullish legwork that’s been put on the table so far, and light a nice fire under the rebound effort.
Click to Enlarge
• In the meantime, resistance at $57.80 has taken shape. That’s where K stock has peaked several times since late March, and it’s near where the gray 100-day moving average is now.
• Though erratic, we’ve seen some major bullish volume days since the latter half of March. There are some willing bulls out there.
• Zooming out to the weekly chart, we simultaneously see the Chaikin line’s moved back above the zero line and a fresh MACD buy signal. We don’t see either serve up fakeout signals very often for Kellogg Company shares.
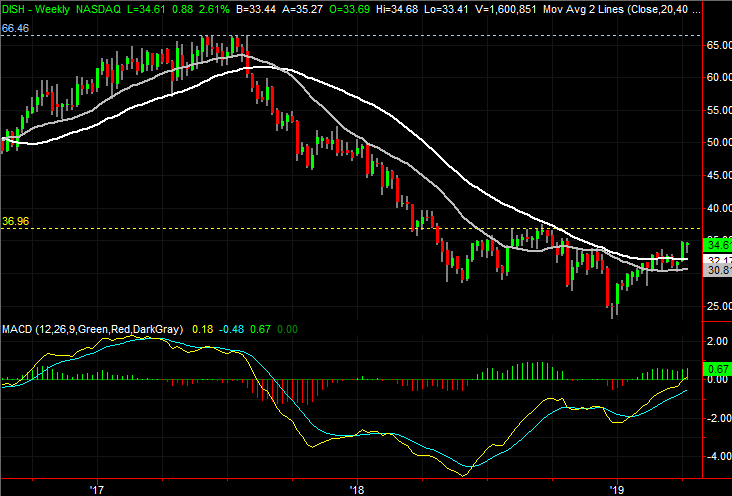
DISH Network (DISH)
With nothing more than a quick glance, DISH Network could be seen as dishing out the same basic volatility it’s been dishing out for the past several months. And, maybe that’s all it is.
A longer, more thoughtful look at the charts of DISH, however, suggests there’s something far more constructive underway than we’ve seen in months. Although it’s still entirely likely we could see sizable pullbacks from here, the bigger-picture tide appears to have taken a nice turn for the better.
Click to Enlarge
• DISH stock is also above horizontal resistance around $34, plotted with a red dashed line on the daily chart. The stock peaked there a couple of times before now, but it wasn’t a problem last week.
• The new convergence of all the key moving average lines is about to set up a cross of the purple 50-day moving average above the 200-day line. These so-called “golden crosses” are a big hint of a tidal change.
• If the rally can get and keep traction and break above the ceiling near $37, there’s no well-established resistance until you get back to 2017’s high around $66.50.
As of this writing, James Brumley did not hold a position in any of the aforementioned securities. You can learn more about James at his site, jamesbrumley.com, or follow him on Twitter, at @jbrumley.